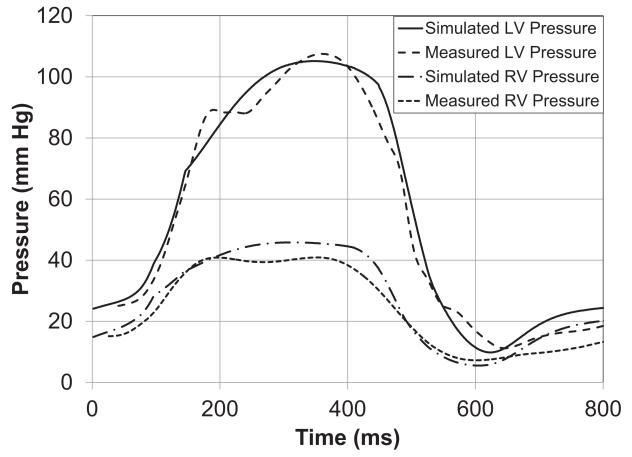
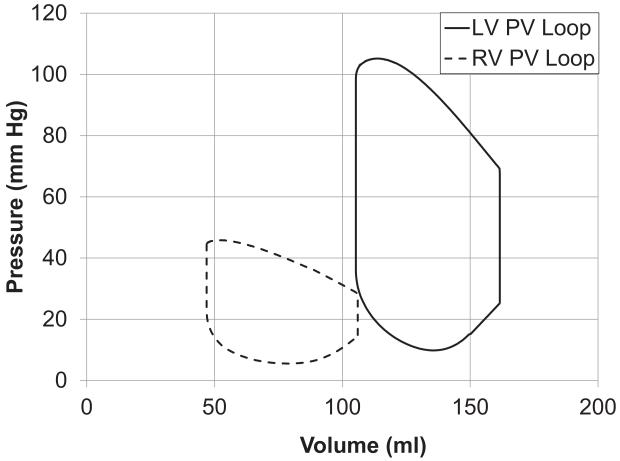
Figure 7.
(A) Left and Right ventricular pressure tracings computed by the model and measured. (B) Model-predicted left and right ventricular pressure-volume loops. (C) Long-axis sectional view of bi-ventricular model at 4 cardiac phases: end-diastole (ED), aortic valve opening (AVO), aortic valve closure (AVC), mitral valve opening (MVO). Fiber strain with respect to end-diastole is rendered in color from −0.15 (blue) to +0.15 (red). Note end-systolic bulging in region of inferior infarct labeled with *.


