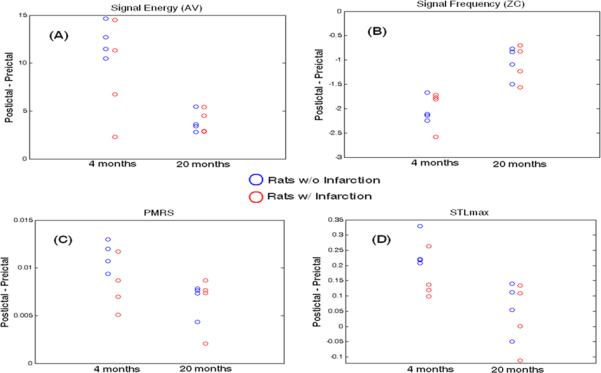
Figure 3.

Resetting (postictal – preictal) quantification for each rat (mean over all 6 channels) with respect to each of the studied qEEGs. The closer the value is to zero, the smaller is the degree of the resetting effect from the SWDs. Non-infarcted animals (blue circles); infarcted animals (red circles).
