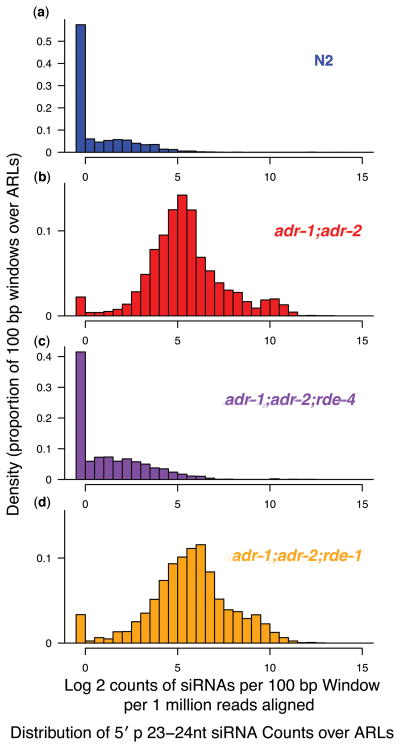
Figure 4.
Dependence of ARL sRNAs on the RNAi machinery. Distribution of small RNA abundances (23–24 nt only) for all 100 bp windows contained in ARLs. Small RNA values are shown as counts per million total reads aligned. Counts for each small RNA alignment was normalized to the total number of distinct genomic alignments of the associated sequence read. Distribution of small RNA counts over ARLs were calculated for each of (a) N2 (blue), (b) adr-1;adr-2 (red), (c) adr-1;adr-2;rde-4 (purple), and (d) adr-1;adr-2; rde-1 (orange). Graphs in this figure aggregate L4 and embryo data (individual distributions for L4 and embryo comparisons show a comparable difference; data not shown). Regions with high sRNA counts in wild-type also have comparable levels in adr-1;adr-2 animals, as is evident when small RNA abundances for each 100 bp region are normalized to wild-type levels (Supplementary Fig. 2c).

