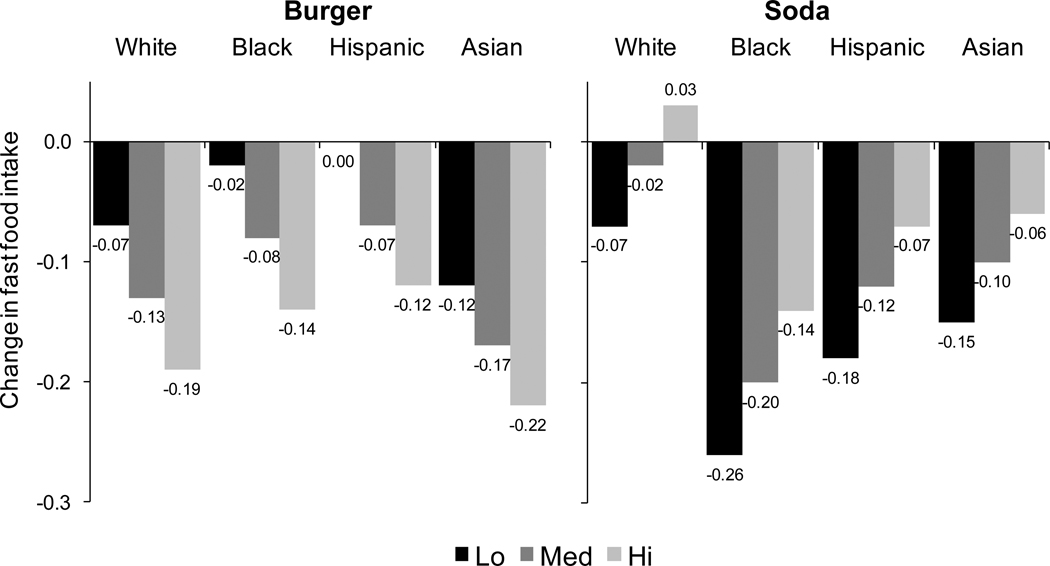
Figure 2.
Twenty percent increase in County-level prices of soda and burgers and associated decrease in number of individual-level fast food eating occasions by individual-level income and race, The National Longitudinal Study of Adolescent Health waves II (1996, 12–22 years) and III (2001, 18–28 years).

