Fig. 7.
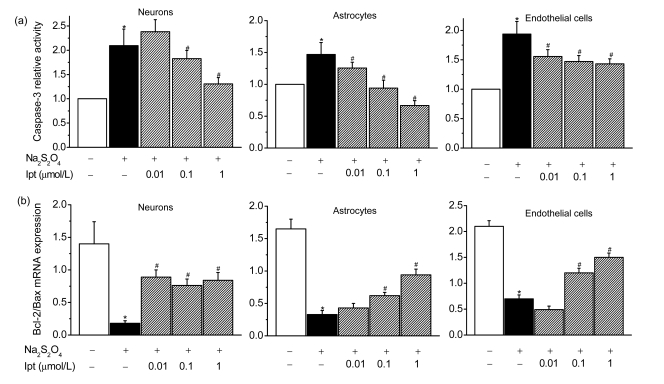
Effects of iptakalim (Ipt; 0.01, 0.1, and 1 µmol/L) on the mRNA expression of caspase-3 (a) and the ratio of Bcl-2 mRNA expression to Bax mRNA expression (b) determined using real-time quantitative PCR in cultures of primary cerebrocortical neurons, astrocytes, and microvascular endothelial cells under hypoxic conditions
Hypoxic conditions were induced using 0.5 mmol/L Na2S2O4. Data are presented as the mean±SEM from four individual experiments. * P<0.05 for cells that received hypoxia condition compared with the normal control group; # P<0.05 for cells that were treated with iptakalim under hypoxia compared with cells exposed to hypoxia without iptakalim

