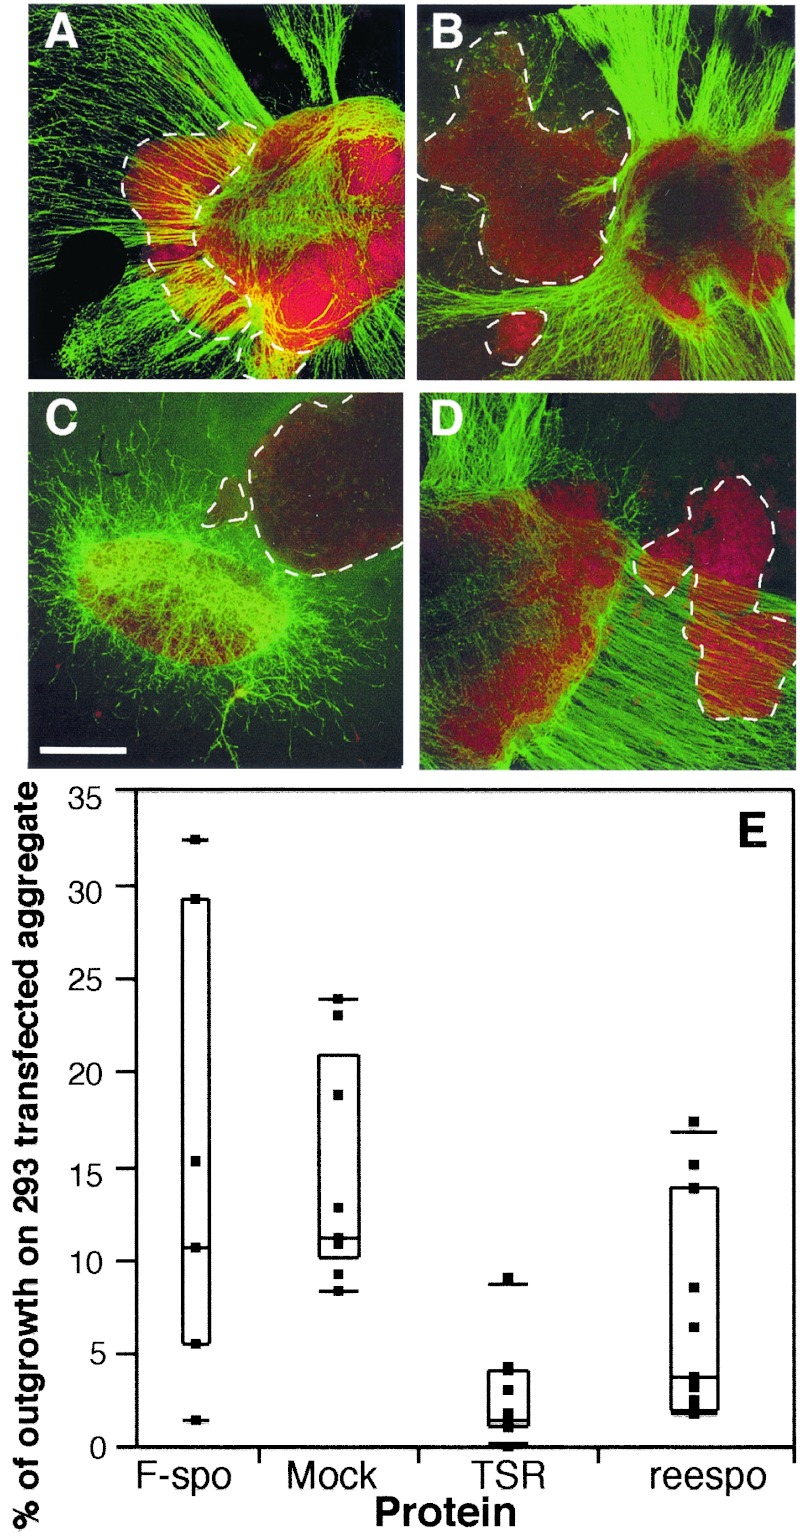
Figure 5.
E11 ventral spinal cord explants were cultured in contact with F-spondin or F-spondin domain-protein transfected HEK 293 cells, as well as mock-transfected HEK 293 cells, for 30 h in a three-dimensional collagen gel matrix and then stained with anti-neurofilament mAb 2H3 (FITC) to visualize axons. At this stage, only motor axons are expected to be found in these explants (20). The cell bodies were stained with propidium iodide. The broken white line demarcates the boundaries of the HEK 293 aggregate. (A) Mock-transfected cells. The neurites grow over the explant. (B) TSR-transfected cells. The neurites extend along the explant boundary but do not invade it. (C) Reespo transfected cells. The neurites extend along the explant boundary but do not invade it. (D) F-spondin-transfected cells. The neurites grow over the explant. (Scale bar in C = 50 μm for A–D.) (E) Quantitative analysis of the observed changes. NIH image software was used to measure the area occupied by the axons over the cell aggregate (aggregate outgrowth) and the total area occupied by axons. A comparison of the percentage of the aggregate outgrowth between the various proteins with the control group (mock-transfected) is presented. Applying Dunnett's method (34) on the ranks shows significant differences among the TSR, reespo, and the control group (mock) but no difference between the F-spondin and the control group under a significant level of α = 0.05.

