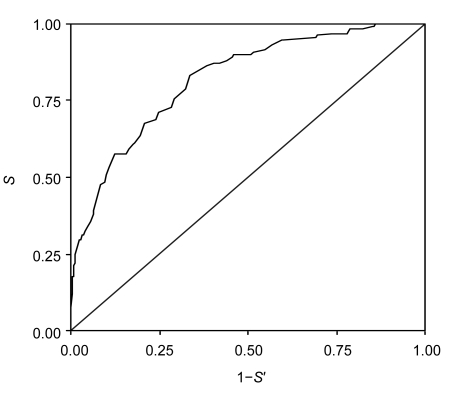
Fig. 1.
Receiver operating characteristics (ROC) curves showing the performance of the diabetes risk score in predicting diabetes
Diagonal segments are produced by ties. The area under the curve (AUC) was 0.82 (95% CI: 0.78–0.86). When the cut-off point of diabetes risk score was ≥51, the sensitivity (S) was 83.3%, specificity (S′) was 66.5%, positive predictive value was 12.83%, and negative predictive value was 98.53%

