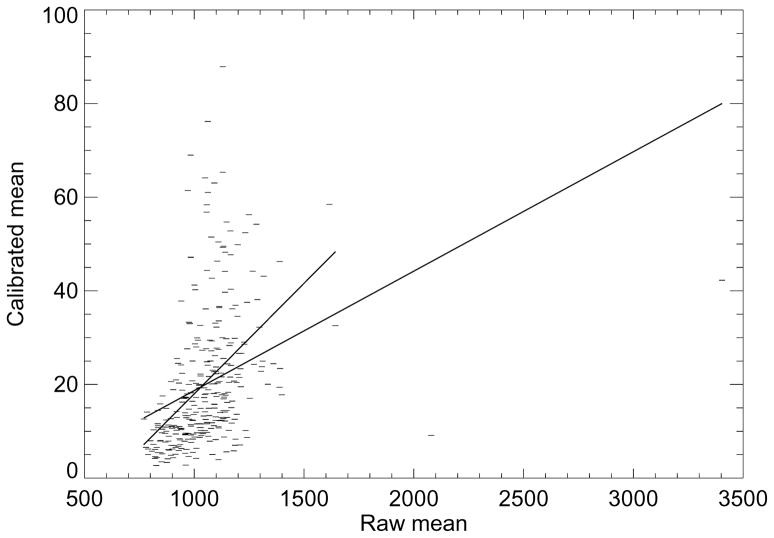
Figure 3.
Mean regression. This plot shows the calibrated mean values modeled as a linear function of the raw image mean values (dashes). The regression fitted lines (solid) indicates the two measures are not described well by this relationship, indicating the calibration has a strong influence. The data was modeled with all the points (line with the longer length) and with three outlines removed (line with the shorter length) from the right. The respective slope (m) and standard errors for each plot were m = 0.026 ± 0.004 and 0. 047 ± 0.005 with R2 = 0.12 and 0.19.

