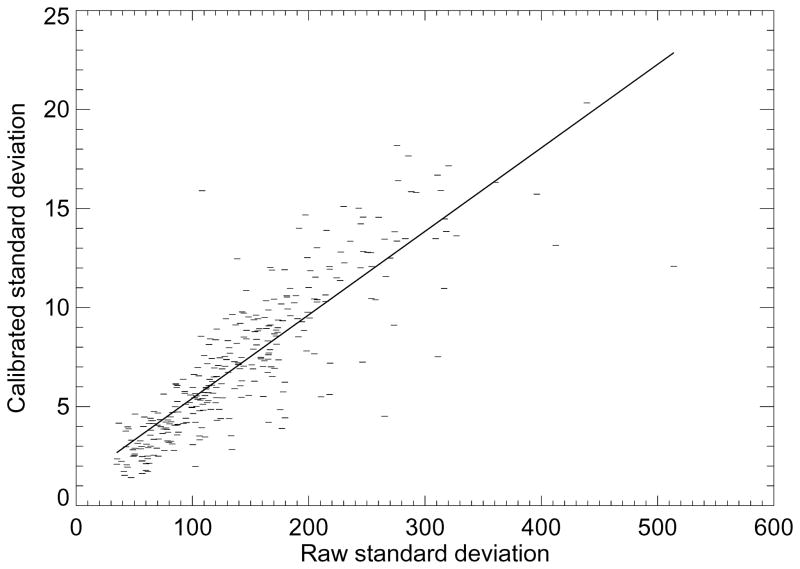
Figure 4.
Standard deviation regression. This plot shows the calibrated standard deviation modeled as a linear function of the raw image standard devotion (dashes). The slope and standard error were m= 0.042 ± 0.002. The regression fitted line (solid) shows the two measures are highly correlated (R2 = 0.73) indicating that the calibration re-scales the standard deviation quantities while approximately maintains the internal distances between the samples.

