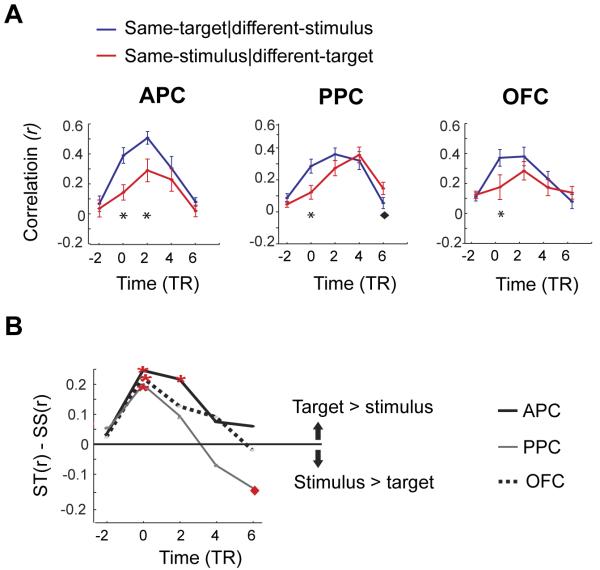
Figure 4.
The temporal evolution of predictive codes and stimulus representations differs across olfactory cortical regions. A. In all three regions, correlations increase prior to stimulus arrival for same-target conditions (blue lines), and remain elevated over same-stimulus conditions (red lines) in APC and OFC. In contrast, the correlation time-course in PPC exhibits two peaks: an early peak for same-target conditions, and then a later peak for same-stimulus conditions, reflecting the observed double dissociation between pattern type (target vs. stimulus) and time (pre vs post) in this region. Each plotted point represents the mean over two consecutive TRs. Black stars indicate time-points where same-target correlations exceed same-stimulus correlations; black diamonds indicate time-points where same-stimulus correlations exceed same-target correlations (at P < 0.05). B. To better visualize these effects, the correlation difference between the blue and red lines in panel A was plotted for each region at each time-point (ST(r), same-target r-value; and SS(r), same-stimulus r-value). A shift in pattern coding from target to stimulus is apparent in PPC at the crossing of the x-axis. Red stars, significant target-related effect; red diamonds, significant stimulus-related effect; P < 0.05.

