Figure 2.

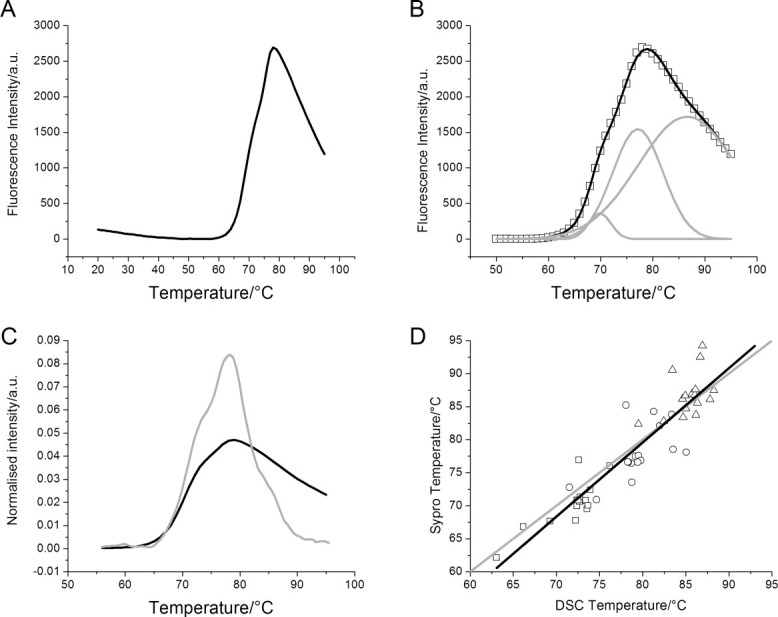
Sypro Orange thermal stability data. A: Representative data showing Sypro Orange fluorescence intensity as a function of temperature. The data have been baseline corrected. B: The same data fitted to three Gaussians. The original data are shown in symbols (□), the three Gaussians are shown as gray lines, and the sum of the Gaussians is the black line. C: Comparing Sypro Orange data with DSC data. Both curves have been normalized to an area under the curve of one. D: For 16 proteins, both Sypro Orange and DSC data were collected; the individual data for Tm1 (□), Tm2 (○), and Tm3 (▵) are shown here. The gray line shows the case where DSC and Sypro Orange data would be identical. The black line is a straight line fit to the actual data points. The slope is 1.12, R = 0.92, and R2 = 0.85.
