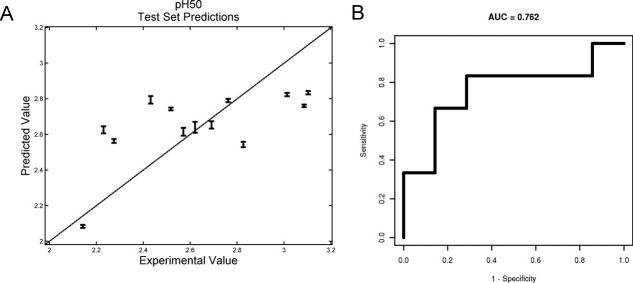
Figure 6.
Model predictions on the pH50 test set. A: Predicted pH50 plotted against actual pH50 for test set antibodies. Error bars show the variance in the predictions across leave-one-out training. B: ROC curve for two-class classification predictions of pH50s. The two classes are defined as high (above the training set median) and low pH50s.

