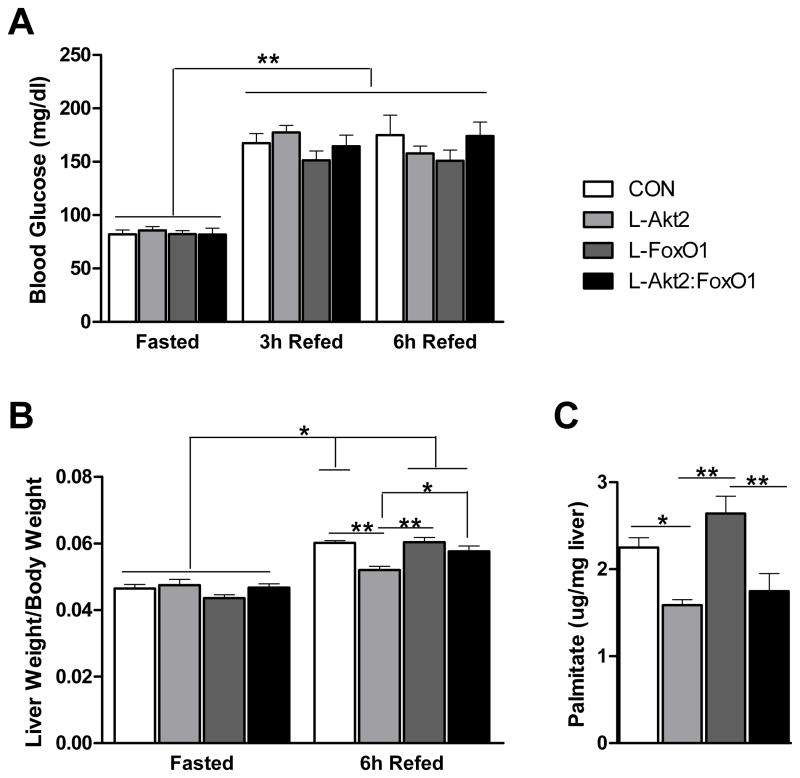
Figure 6. Loss of Hepatic Akt2 Decreases de novo Lipogenesis Independent of FoxO1.
(A) Fasting and refed blood glucose levels. Two-month-old male mice were placed on HCD for three days, fasted overnight, and refed with HCD for 6 hours. Blood glucose levels were taken at fasting, 3h refeeding and 6h refeeding time points, n= 5–7 for each genotype, **, P < 0.01 by two-way ANOVA followed by Bonferroni’s post-test, error bars represents SEM.
(B) Liver weight to body weight ratio. Mice were as described above. 6h after refeeding, mice were sacrificed, and body weight and wet liver weight were determined, n=5–7 for each condition, *, P < 0.05, **, P < 0.01 by two-way ANOVA followed by Bonferroni’s post-test, error bars represents SEM.
(C) De novo lipogenesis, n=4–7 for each genotype, **, P < 0.01 by one-way ANOVA followed by Tukey’s post-test; error bars represents SEM. Abbreviations are as indicated in Figure 2.

