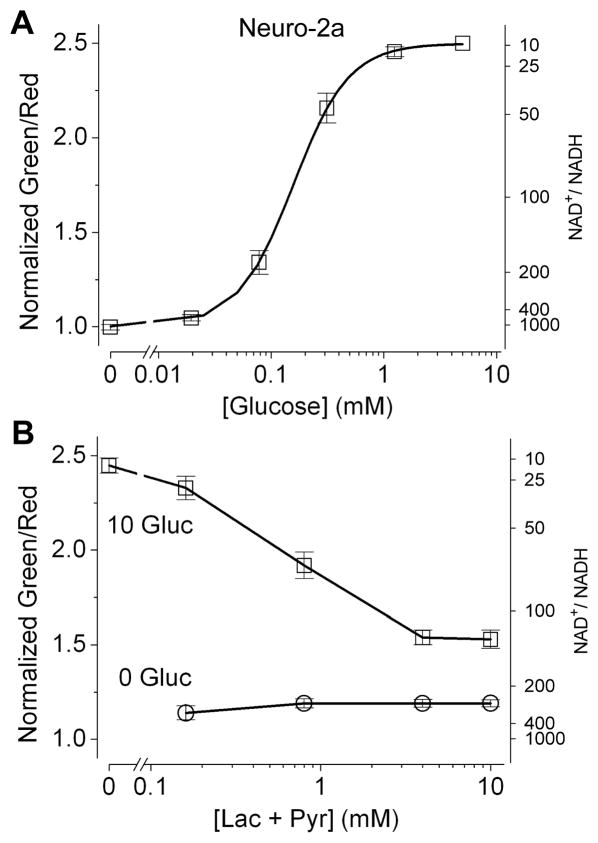
Figure 4. Cultured mouse neuroblastoma Neuro-2a cells supplied with glucose show a more reduced cytosolic NADH-NAD+ redox state.
(A) Steady state fluorescence responses of Neuro-2a cells plotted against concentrations of extracellular glucose (mean ± SEM, n = 19 cells from two independent experiments). (B) Steady state fluorescence responses of Neuro-2a cells plotted against total concentrations of extracellular lactate and pyruvate, with a constant lactate:pyruvate ratio of 10, and glucose of 10 mM or 0 mM (mean ± SEM, n = 7 cells from three independent experiments). For the alternate y axis, the predicted NAD+:NADH ratio was calculated from purified protein measurements. p < 0.001 (paired t-test) for all conditions in 10 mM vs. 0 mM glucose.

