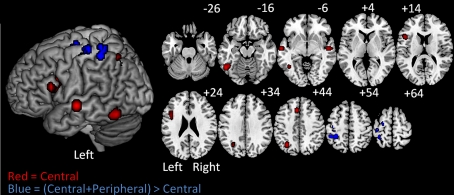
Figure 3.
On the left are ALE Meta-analysis results projected on a standard rendered template brain and on the right are the corresponding axial slices from z −26 to +64 in 10 mm increments. In red are the clusters corresponding to the central-contrast analysis. These clusters correspond to the central processes of written word production. In blue are the clusters identified in the (central + peripheral) > central-contrast analysis. These clusters correspond to peripheral processes of written production.

