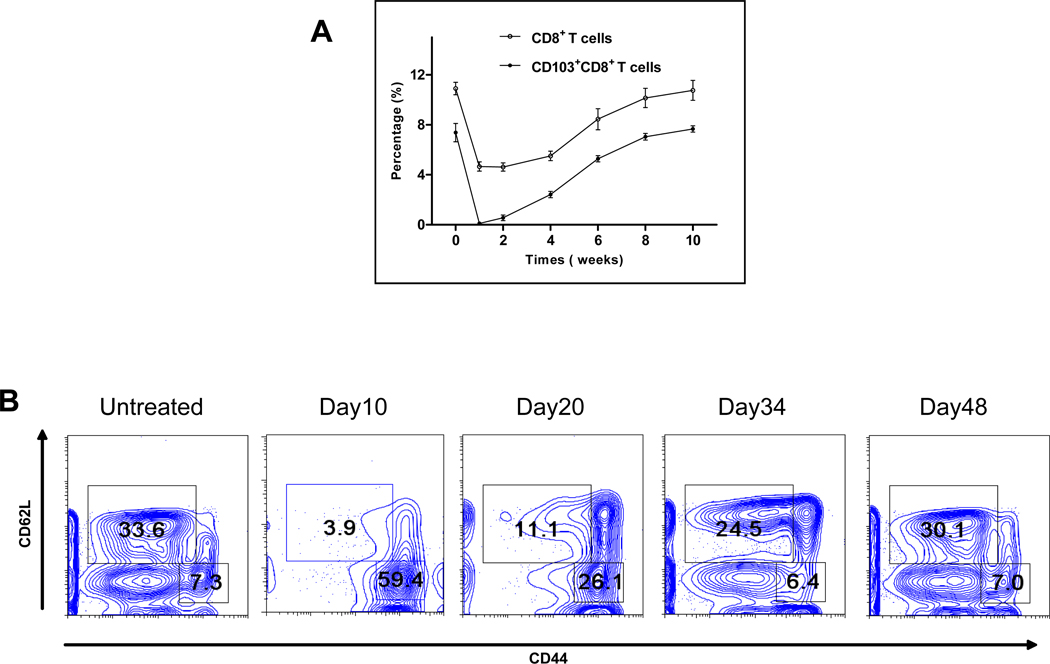
Figure 3. Depletion and recovery of peripheral CD8 T cells.
8 to 10-week-old C57BL/6 mice were treated with M290-SAP at 2mg/kg i.p.. Peripheral blood was collected at the designated time points and subjected to three-color FACS analyses using mAbs to CD3, CD103, and CD8. A. Depletion and recovery of peripheral CD8 T cells. Data shown are mean percentages ± SEM of CD8+ (empty circle) and CD103+CD8+ (filled circle) T cells among total lymphocytes (n = 5). B. Depletion and recovery of naïve and memory CD8 T cells. Data shown are two-dimensional plots of CD62L vs. CD44 expression for gated CD8+ lymphocytes.

