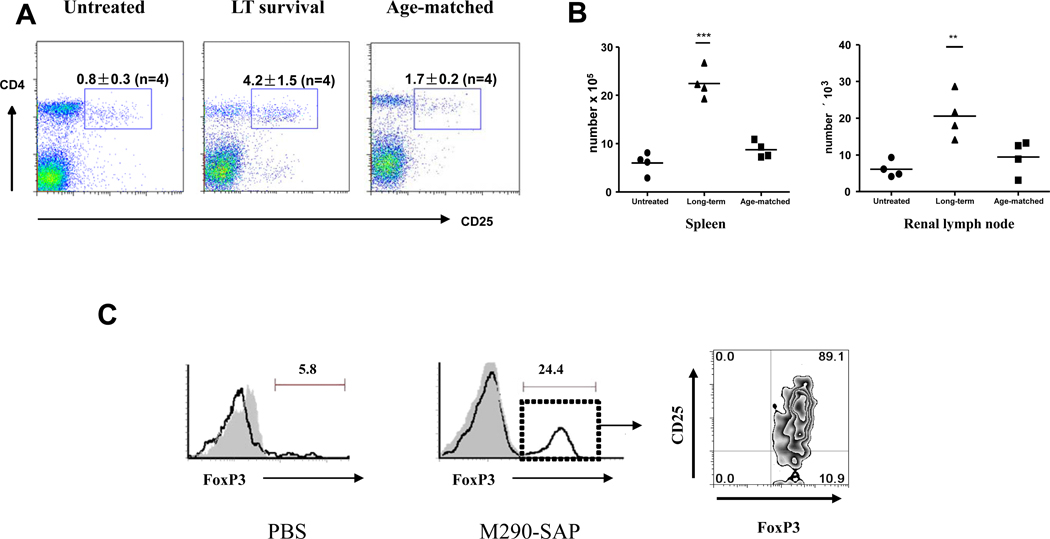
Figure 8. Increased numbers of CD4+CD25+ T regulatory cells in M290-SAP treated recipients bearing long-term islet allografts.
A. Phenotypic analysis of splenocytes from mock injected recipients undergoing unmodified rejection at POD 15 (left), M290-SAP treated recipients bearing long-term islet allografts harvested at POD 100 (middle), or age matched (age 150 days) normal C57BL/6 controls, were subjected to multi-color FACS analyses using mAbs to CD4, CD25. Data shown are two-dimensional plots of the indicated markers by gated lymphocytes. Numbers in quadrants are percentages of total lymphocytes. B. Absolute numbers of CD4+CD25+ cells in the spleen (left) and renal lymph node (right) for the three groups as described in A The horizontal line denotes the mean of the points within each group. Statistically significant differences were measured by one-way ANOVA with posttesting by Dunnett’s Multiple Comparison Test. ***denotes p<0.001, ** denotes p<0.01. C. Phenotypic analysis of lymphocytes infiltrating islet allografts in mock injected controls at POD 15 (left panel) or an M290-SAP treated recipient bearing long-term islet allograft harvested at POD 100 (right panels). Data shown in far right panel is a two-dimensional plot of CD25 vs. FoxP3 expression by gated CD4+ cells in the long-term surviving islet allograft.

