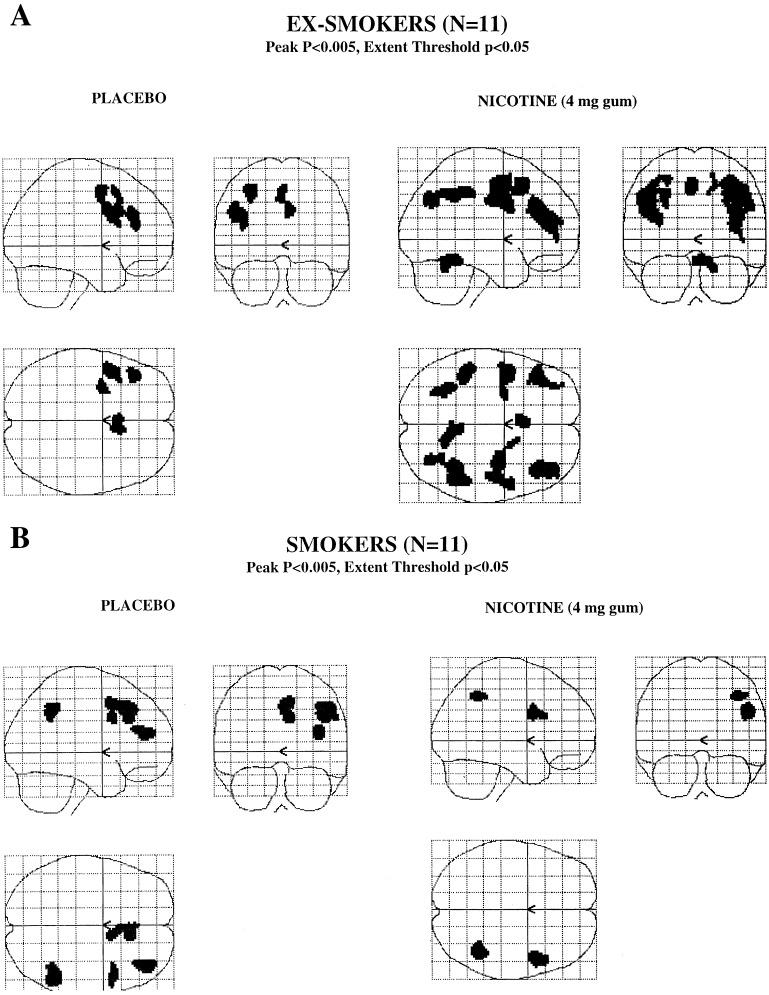
Figure 1.
Statistical parametric maps showing brain activation during performance of the 2BT by ex-smokers (Upper) and smokers (Lower) (n = 11 per group) when given placebo or 4-mg nicotine gum (Left and Right, respectively). Maps of the z statistics show all voxels significantly activated at P < 0.005 (peak) within a cluster of an extent threshold of P < 0.05.

