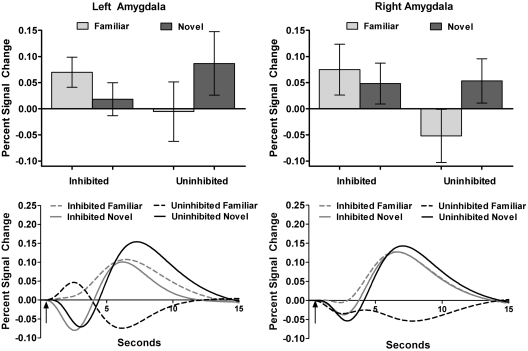
Fig. 2.
Inhibited temperament group shows similar activation to novel and newly familiar faces. In the top panel, bar graphs show average percent signal change values (relative to baseline) for the familiar and novel faces for each temperament group. Lines represent standard error or the mean. In the bottom panel, the time course line graphs illustrate the average hemodynamic response functions by temperament group and face type, with arrows indicating when the face was presented (0.5 s).

