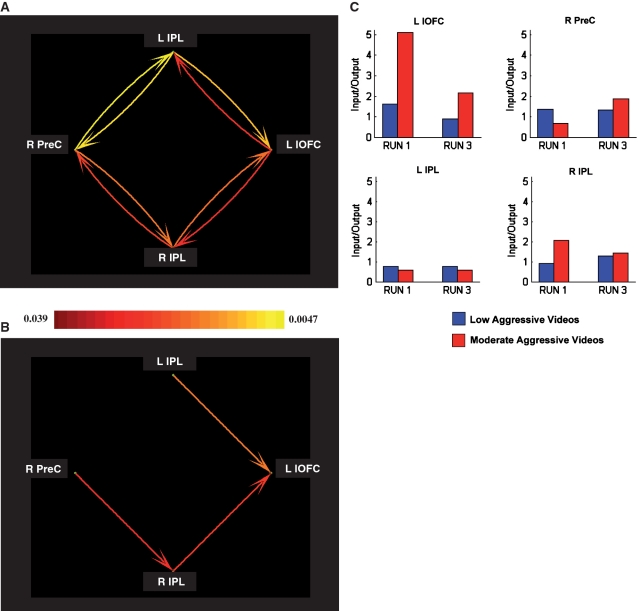
Fig. 3.
Multivariate GCM analyses. Effective connectivity network and strengths are displayed. (A) Granger causality network for aggression. The Prec and lOFC were reciprocally connected with both the left and right IPL, but were not directly connected. A pseudo-color code was used to indicate the path weights of all connections between ROIs. (B) Granger causality network for dominant directional influences. Two dominant directional pathways were found that gave input to the lOFC, indicating that this region is mainly driven by other ROIs: inter-hemispherically, from the Prec via the right IPL (Prec → R IPL) to the lOFC (R IPL → lOFC) and intra-hemispherically, from the left IPL to the lOFC (L IPS → L lOFC). The color scales in A and B are weighted by the P-values of the corresponding paths. (C) Input–output ratio for ROI activations. Only for left lOFC, the input–output ratio decreased significantly over time for the moderately aggressive videos, but not for the low aggressive videos.

