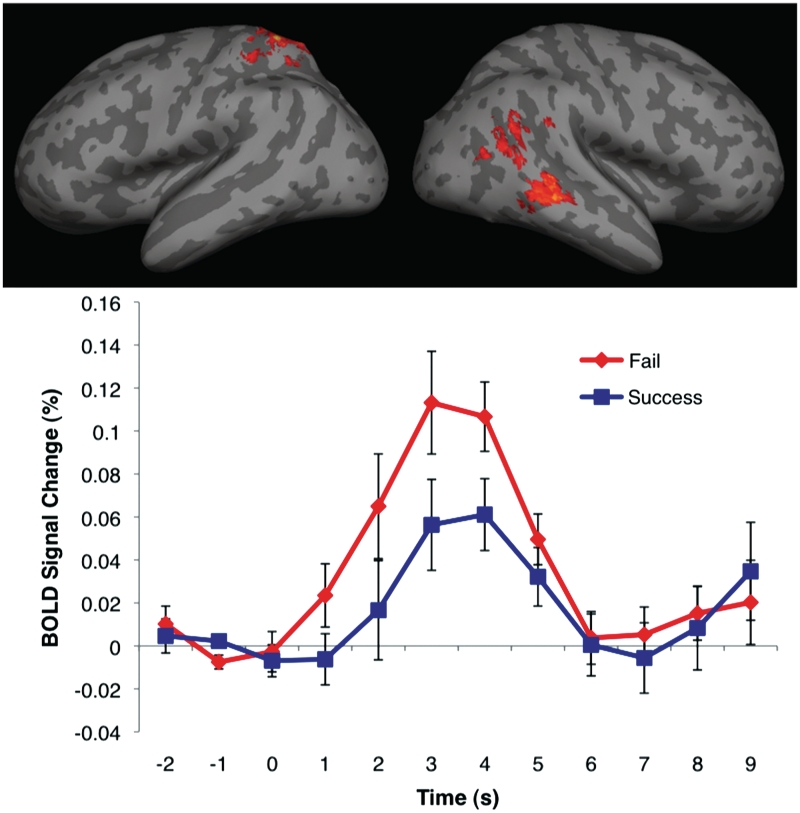
Fig. 2.
Top panel: activation map from FAILED vs SUCCESSFUL contrast, displayed on a cortical surface representation. In all images, the color bar ranges from z = 2.3 (dark red) to 3.8 (bright yellow). Bottom panel: average BOLD signal change time courses from the activated voxels in the right pSTS from epochs corresponding to failed and successful actions. Error bars indicate standard error of BOLD signal at a given time point. Movie presentation begins at 0 s and ends at 3 s.

