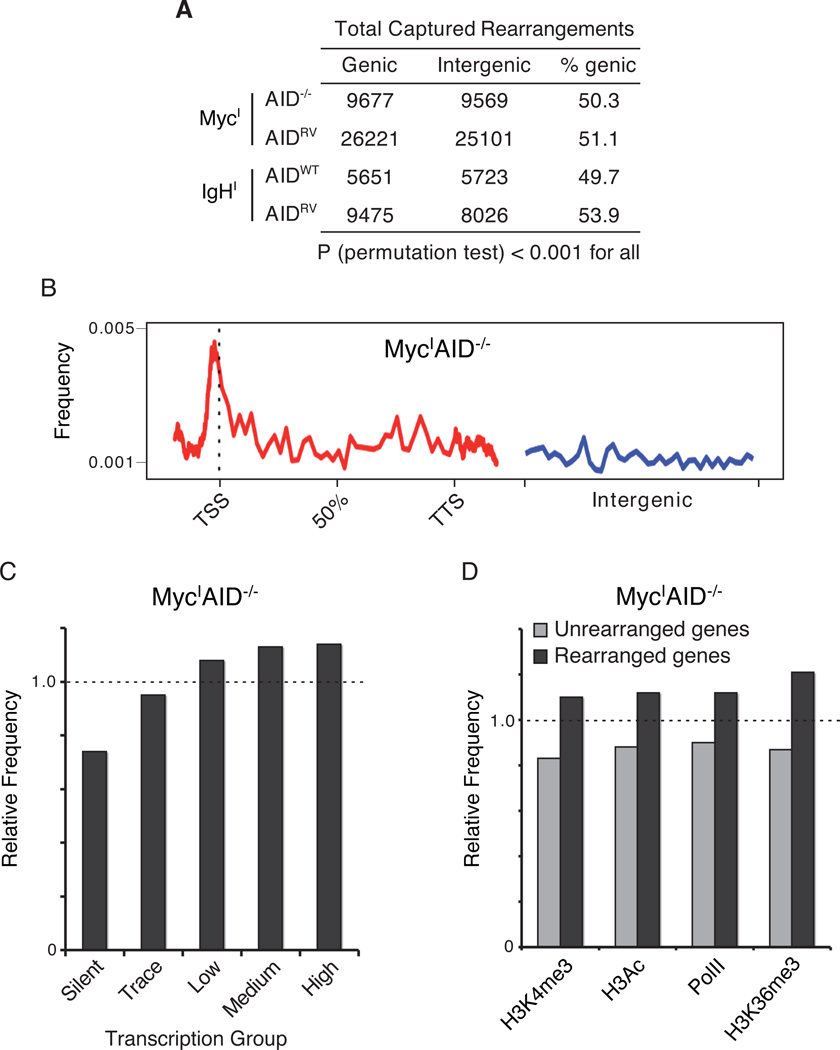
Figure 3. Rearrangements to MycI occur near the TSSs of actively transcribed genes.
(A) Rearrangements, excluding the 1 Mb around I-SceI, were categorized as genic or intergenic. (B) Composite density profile of genomic rearrangements from MycI to genes (red line) and intergenic (blue line) regions. TSS = transcription start site, TTS = transcription termination site. (C) Relative frequency (fe) of rearrangements in genes that are either silent or display trace, low, medium or high levels of transcription in activated B cells as determined by RNA-Seq (Figure S1). Dashed line indicates the expected rearrangement frequency based on a random model. P < 0.001 for all (permutation test). (D) Relative frequency of rearrangements in PolII- and activating histone mark-associated gene groups (Yamane et al., 2011). Dashed line indicates expected frequency based on a random model. P < 0.001 for all samples (permutation test). Also see Figure S1.

