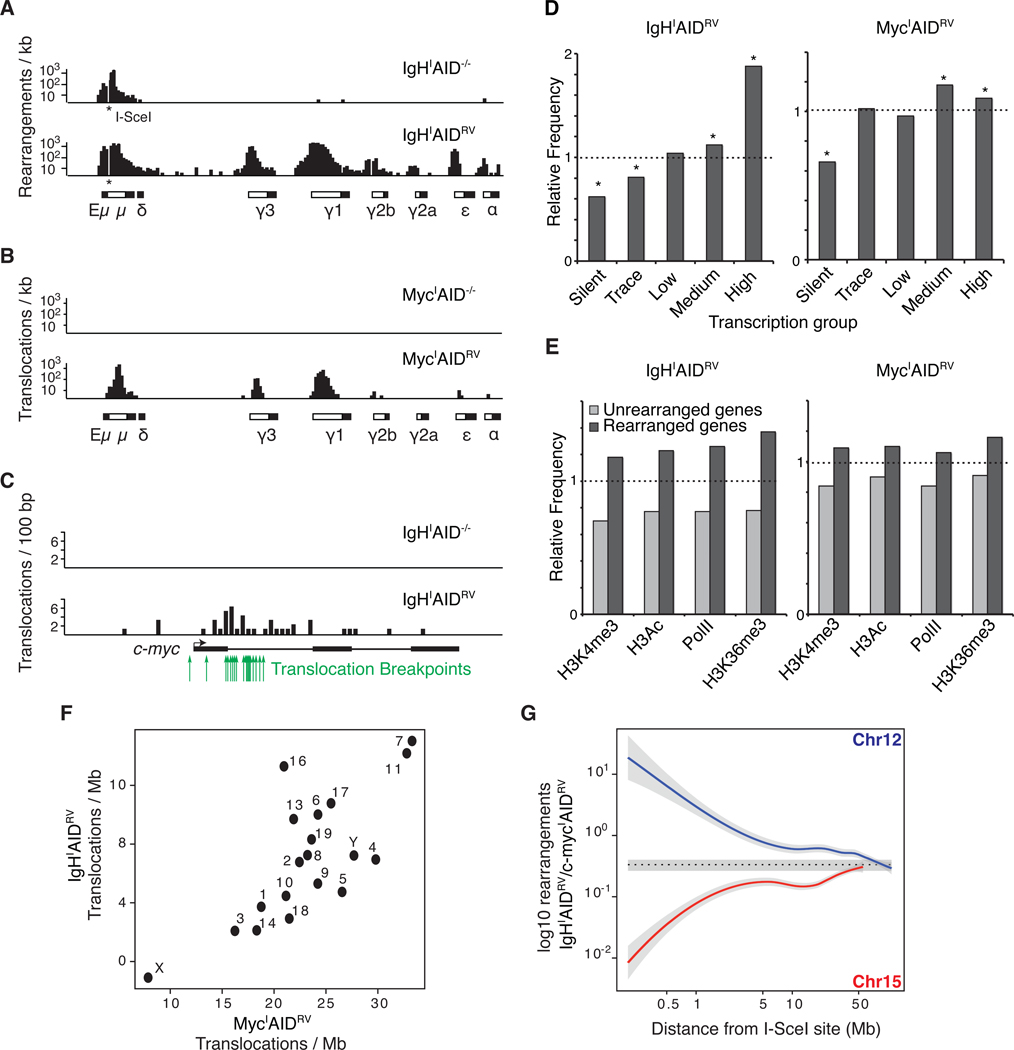
Figure 4. Rearrangements to IgHI or MycI in primary B cells expressing AID.
(A) Rearrangements per kb to I-SceI sites (indicated with an asterisk) in IgH or (B) c-myc in AID−/− (top panel) or AIDRV cells (bottom panel). White boxes in the schematics below each graph represent Ig switch domains while black boxes depict constant regions. (C) Translocations per 100 bp from IgHI to c-myc in AID−/− (top panel) or AIDRV cells (bottom panel). Green arrows indicate c-myc/IgH translocation breakpoints sequenced from primary B cells (Robbiani et al., 2008). (D) Relative frequency of rearrangements in transcription-level gene groups (Figure S1), dashed line indicates expected frequency based on a random model. Asterisks highlight values with a P < 0.001 (permutation test). (E) Relative frequency of rearrangements in PolII-associated or activating histone mark-associated gene groups (Yamane et al., 2011). Dashed line indicates the expected frequency based on a random model. P < 0.001 for all samples (permutation test). (F) Graph comparing the number of translocations per mappable megabase to each chromosome from IgHI (y axis) or MycI (x axis). (G) Ratio of IgHI captured to MycI captured events in 500 kb bins moving away from the I-SceI capture site (both directions combined). Dotted line represents the average trans-chromosomal joining rate computed on all chromosomes other than 12 or 15. Gray areas show 2 standard deviations around the mean. Also see Figure S2.

