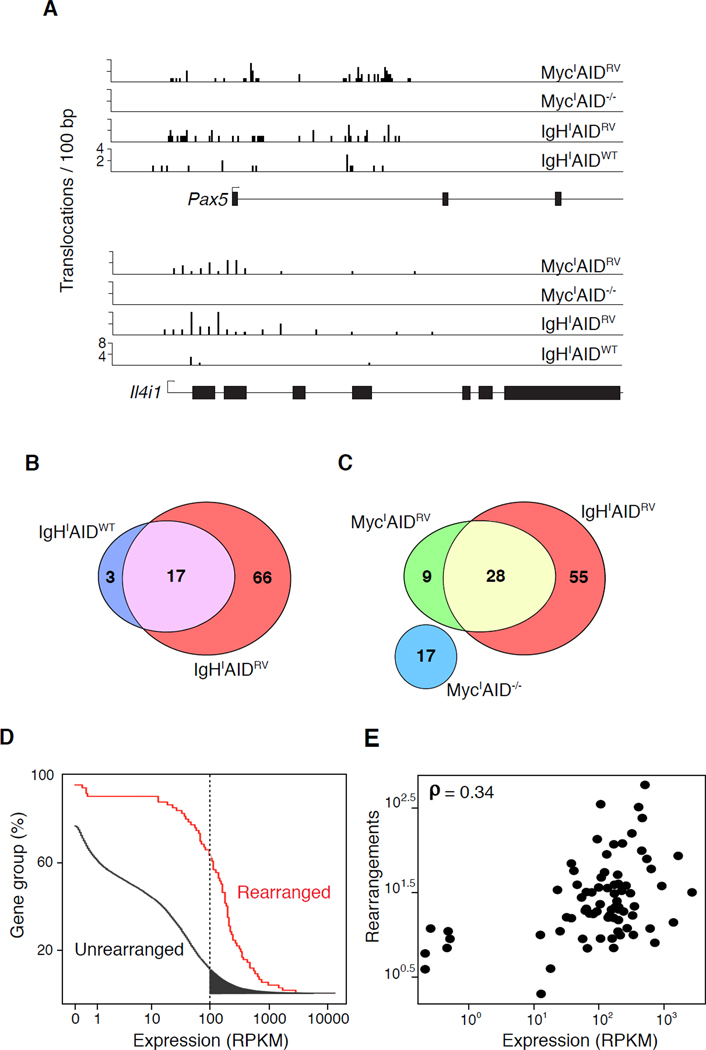
Figure 5. AID-dependent rearrangement hotspots.
(A) Screenshots of translocations per 100 bp present at Il4i1 and Pax5 genes in all samples. (B) Overlap of AID-dependent hotspot-bearing genes in IgHIAIDRV and IgHIAIDWT experiments. (C) Overlap of AID-dependent hotspot-bearing genes in IgHIAIDRV, MycIAID−/− and MycIAIDRV experiments. (D) Empirical cumulative distribution showing transcript abundance in genes displaying (red) or lacking (black) rearrangement hotspots. Filled-in gray slice represents ~2000 highly transcribed unrearranged genes. (E) Total rearrangements as a function of gene expression (RNA-Seq) (Yamane et al., 2011) in genes bearing rearrangement hotspots. Also see Figure S3.

