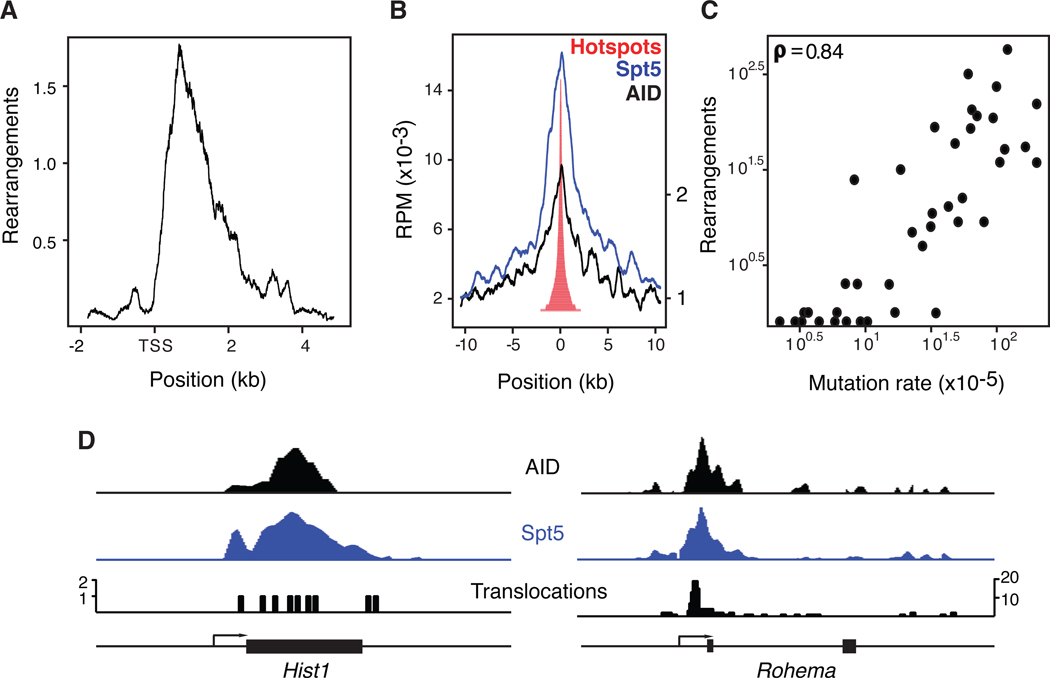
Figure 6. Characterization of AID-dependent hotspots.
(A) Composite density graph showing the distribution of rearrangements in genes associated with AID-dependent hotspots relative to the TSS. (B) Spt5 and AID recruitment at genomic sites associated with translocation hotspots (Pavri et al., 2010; Yamane et al., 2011). (C) Somatic hypermutation frequency versus number of rearrangements in genes bearing AID-dependent translocation hotspots. (D) Distribution of AID, Spt5 and translocations in Rohema and Hist1 genes. Also see Figure S4.

