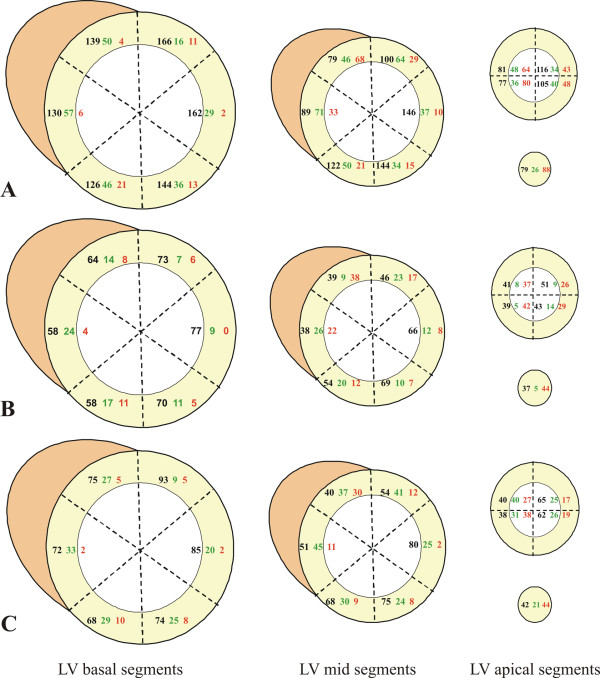
Figure 4.
Scar distribution in the studied population (A), in the group without substantial viability (B) and in the group with substantial viability (C). The black numbers correspond to the left ventricular (LV) segments with no late gadolinium enhancement (LGE), the green to the segments with scar thickness ≤50% and the red to the segments with a scar thickness > 50%.

