Fig. 2.
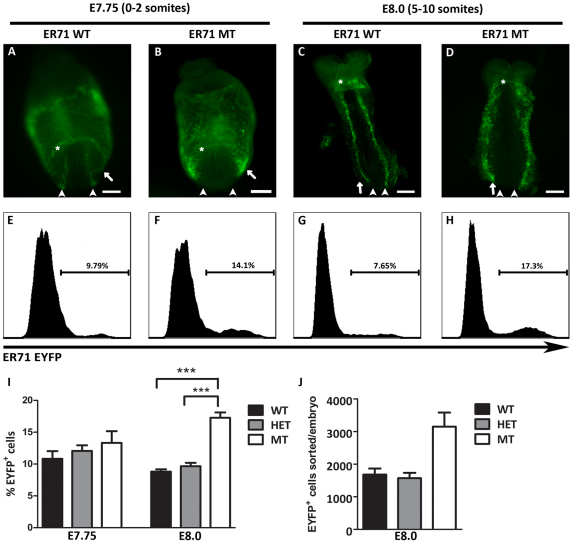
The ER71 reporter is misexpressed in Er71 mutant embryos. (A-H) EYFP expression in Er71 wild type (A,C,E,G) and mutant (B,D,F,H) mouse embryos at E7.75 (A,B,E,F) and E8.0 (C,D,G,H). Asterisks indicate the cardiac crescent (A,B) or forming linear heart tube (C,D). Arrowheads indicate the bilateral dorsal aortae (C,D) or its progenitors (A,B). Arrows point to regions in which EYFP is misexpressed in the mutant (A-D). Representative FACS profiles of individual embryos (E-H) show the percentage of EYFP positive cells per embryo. Scale bars: 200 μm. (I) The percentage of EYFP+ cells for all experiments. (J) The average number of EYFP+ cells sorted per embryo. WT, wild type; HET, Er71 heterozygote; MT, homozygous Er71 mutant. ***, P<0.001. Error bars indicate s.e.m.

