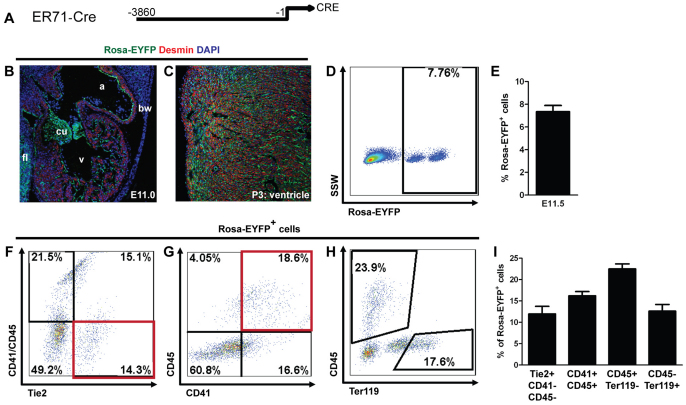
Fig. 6.
Genetic fate-mapping studies indicate that ER71-expressing cells give rise to the endothelial and hematopoietic lineages. (A) The transgenic Er71-Cre mouse model used for these studies. (B,C) Immunohistochemistry for GFP (green) and desmin (red) and DAPI staining (blue) in E11.5 (B) and P3 (C) heart. a, atria; bw, body wall; cu, cardiac cushion; fl, fetal liver; v, ventricle. (D) A representative FACS profile showing EYFP+ versus side scatter width (SSW). (E) Percentage of Rosa-EYFP+ cells from all experiments (n=9). (F-H) EYFP-positive cells were gated and analyzed for lineage contribution. Representative FACS profiles are shown for (F) endothelial lineage (CD41– CD45– Tie2+) cells and (G) CD41+ CD45+, (H) CD45+ Ter119– and Ter119+ CD45– hematopoietic lineage cells. (I) Percentage of Rosa-EYFP+ cells of each lineage from all experiments (n=9). Error bars indicate s.e.m.

