Abstract
Aims:
This study was designed to evaluate the relationship of sonographic measurements of umbilical cord thickness, cross-sectional area, and coiling index with pregnancy outcome (low birth weight, 5-min Apgar score, and meconium staining).
Materials and Methods:
From January 2010 to January 2011, among 255 singleton pregnant women who were referred for routine pregnancy USG after 20 weeks of gestation, 223 fulfilled the study criteria. In these patients, the diameter, cross-sectional area, and coiling index were measured in a free loop of umbilical cord. The pregnancies were followed till delivery, when birth weight, presence of meconium staining, and 5-min Apgar score were recorded. The sonographic measurements and clinical findings were analyzed to determine any correlation.
Results:
A statistically significant correlation was observed between small umbilical cord thickness and cross-sectional area and low birth weight (LBW), with sensitivity of 52.9% and 57.9%, specificity of 95.0% and 94.4%, positive predictive value of 52.6% and 52.0%, and negative predictive value of 95.0% and 95.0%, respectively. Also noted was significant correlation between small umbilical cord thickness and cross-sectional area with meconium staining (P<0.001). No significant correlation was seen between umbilical cord thickness and cross-sectional area with low 5-min Apgar score. There was no statistically significant correlation between umbilical cord coiling index and LBW, 5-min Apgar score, and meconium staining.
Conclusion:
Umbilical cord diameter and cross-sectional area measured after 20 weeks of gestation are useful for predicting LBW and meconium staining and have the potential to serve as markers for adverse pregnancy outcome.
Keywords: Coiling index, cross-sectional area, low birth weight, umbilical cord diameter
Introduction
For many years, evaluation of umbilical cord morphology was restricted to the post-partum period and was performed by pathologists who demonstrated that a thin umbilical cord was associated with adverse pregnancy outcome.[1,2] A lean umbilical cord was reported to be associated with small-for-gestational-age (SGA) neonates by Raio and colleagues.[3] Goynumer et al, found significant differences in mean gestational age, mode of delivery, birth weight, and adverse perinatal outcome between fetuses with umbilical cord thickness below the 5th centile (lean umbilical cord) vs. those with umbilical cord thickness above the 5th centile (non-lean cord) in the first and early second trimesters of gestation.[4] In a study on fetuses with sonographically measured low umbilical cord cross-sectional area, Ghezzi et al, found a significant relationship between umbilical vein cross-sectional area below the 10th percentile and adverse neonatal outcome.[5]
Nomograms have been constructed for diameters of umbilical cord and umbilical vein and arteries by Weissman et al[6] for umbilical cord thickness between 18th and 23rd weeks of gestation by Predanic et al,[7] for cross-sectional areas of umbilical vein, artery, and Wharton's jelly between 24th and 39th weeks of gestation by Togni et al,[8] and for umbilical cord and vessel diameters in the first trimester in Thai fetuses by Phaloprakarn et al.[9] The association between a low umbilical cord coiling index (UCI) and antenatal and perinatal complications was demonstrated by Gupta et al.[10] In a study performed by Predanic et al, abnormal umbilical cord coiling in the second trimester was associated with higher prevalence of SGA fetuses.[11]
This study examines the value of umbilical cord thickness, cross-sectional area, and coiling index in predicting pregnancy outcome.
Materials and Methods
Institutional review committee approval as well as patients’ written informed consent was obtained prior to conducting the study. This prospective study involved 255 pregnant women undergoing routine USG evaluation between January 2010 and January 2011. The inclusion criteria were: (1) singleton gestation, (2) reliable gestational age (that was more than 20 weeks at the time of sonography), (3) normal amniotic fluid index (between 8–24 cm), and (4) presence of a three-vessel umbilical cord. Patients were excluded if there was any fetal congenital anomaly or any maternal disorder or complication of pregnancy (e.g., diabetes mellitus, hypertension, etc.) that might interfere with fetal growth or if the patient could not be followed till delivery for any reason.
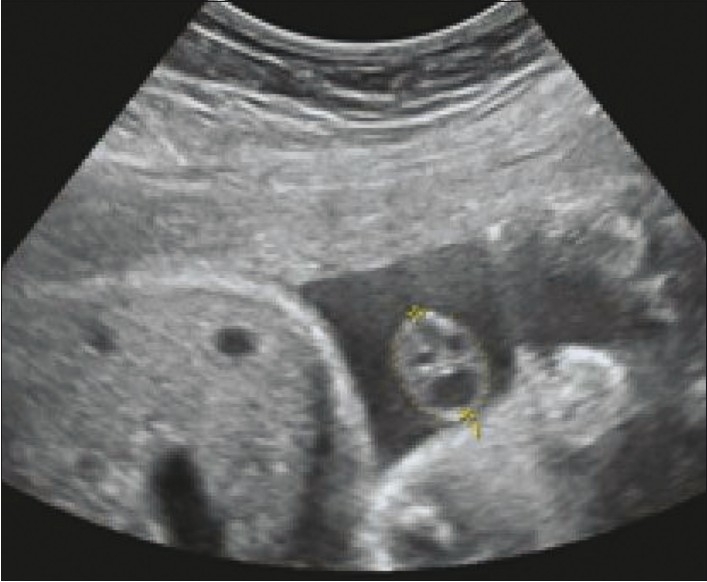
Gestational age was based on a reliable last menstrual period or the earliest USG examination before 20 weeks of gestation. Routine pregnancy USG was performed in all cases and a normal amniotic fluid index was confirmed. Fetal anomaly was ruled out by an anatomic survey. Then, umbilical cord thickness, cross-sectional area, and coiling index were measured in a free-floating loop of umbilical cord using the software in the USG unit [Figure 1]. All USG examinations were performed with standard USG scanners (Siemens G40, Siemens Medical Solutions, USA and GE Voluson 730Expert, General Electric Inc., USA), using a 3.5-MHz convex transducer. Each patient was included only once in the study.
Figure 1.

Tranverse USG shows the method of measurement of the cross-sectional area of the umbilical cord (dotted circle)
Measurements were performed by marking the outer edges of the umbilical cord for thickness and by encircling the outer edge of the cord in transverse section for cross-sectional area [Figure 1]; UCI was calculated as a reciprocal value of the distance between the inner edge of one artery to the outer edge of the same artery at the adjacent umbilical twist along the ipsilateral cord side.
Patients were followed till delivery; maternal age, gestational age at the time of delivery, presence of meconium-stained amniotic fluid, and neonatal birth weight were recorded. The newborns were considered as low birth weight (LBW) when the birth weight was below 2500 g. Macrosomia was defined as birth weight above 4000 g. Apgar score was assigned low if below 7. Meconium-stained amniotic fluid was considered to be present when the fluid was opaque and not watery. Umbilical cord diameter, cross-sectional area, and coiling index were considered low if below the 10th centile and high if above the 90th centile (10th and 90th centiles were calculated for each parameter using the data collected in our study).
Statistical analysis was performed using SPSS® for Windows® (Version 16.0). The values of continuous variables were presented as mean ± standard deviation. Pearson correlation test and chi-square test were used for data analyses. P<.05 was considered significant. Sensitivity, specificity, positive predictive value (PPV), and negative predictive value (NPV) were calculated.
Results
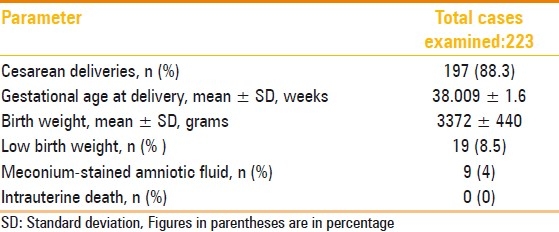
During the study period, 223 patients met the inclusion criteria. The mean maternal age was 28 years (range 18–45 years). Most patients delivered at term and the mean gestational age at delivery was 38.009±1.6 weeks (range: 32–43 weeks). The mean birth weight was 3372.12±440.7 g (range: 1950–4350 g). Most newborns had normal 5-min Apgar score although the range was between 4-10.The delivery data is listed in Table 1. Table 2 shows the descriptive statistics for umbilical cord thickness, cross-sectional area, and coiling index, along with the calculated 10th and 90th percentiles that were used to stratify the umbilical cords into lean/non-lean and hypo/normo/hypercoiled groups.
Table 1.
Delivery data

Table 2.
Descriptive statistics for umbilical cord anthropometric parameters

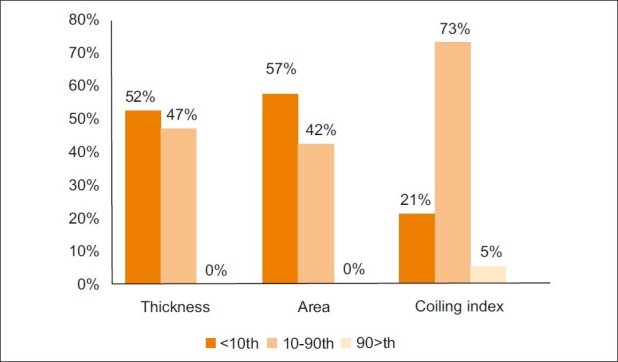
When the proportion of LBW neonates was compared between these groups, it was found that LBW was strongly associated with umbilical cord thickness and cross-sectional area below the 10th percentiles (P<0.01 for both). However, there was no statistically significant correlation between LBW and UCI [Figure 2].
Figure 2.

Chart shows the incidence of low birth weight (LBW) in groups with normal and abnormal umbilical cord parameters
The sensitivity, specificity, PPV, and NPV of cord thickness and area of cord for predicting LBW were also calculated and are shown in Table 3.
Table 3.
Predictive values of umbilical cord thickness and crosssectional area for low birth weight

When the 5-min Apgar scores were stratified according to the umbilical cord anthropometric percentiles, we found that of the 14 neonates with low Apgar scores, eight had normal umbilical cord thickness, seven had normal umbilical cross-sectional area, and 12 had normal UCI. Using the Pearson correlation test, we found no statistically significant correlation between 5-min Apgar scores and umbilical cord thickness (P=0.25, Pearson's r=0.076), umbilical cord cross-sectional area (P=0.442, Pearson's r=0.052), or UCI (P=0.648, Pearson's r=-0.031).
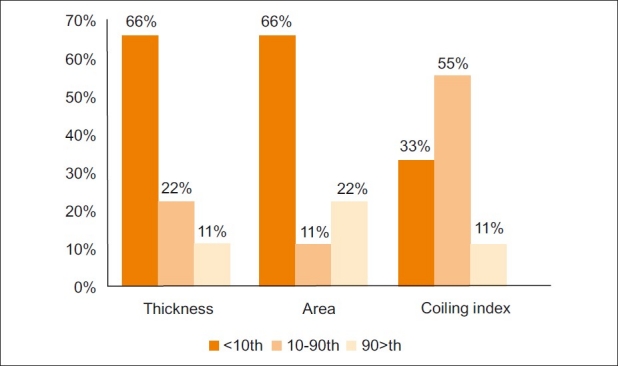
There was significant association between meconium-stained amniotic fluid and umbilical cord thickness (Chi-square value 42.783; degrees of freedom 2; P<0.001) and cross-sectional area (Chi-square value 55.671; degrees of freedom 2; P<0.001). No statistically significant correlation was found between meconium-stained amniotic fluid and UCI (Chi-square value 5.706, degrees of freedom 2; P=0.058) [Figure 3].
Figure 3.

Chart shows the incidence of meconium-stained amniotic fluid in groups with normal and abnormal umbilical cord thickness, cross-sectional area, and coiling index
Discussion
It is believed that Wharton's jelly protects the umbilical cord vessels and so a reduction in its amount – due to extracellular dehydration or due to reduction in extracellular matrix – may predispose these vessels to compression or bending.[3] Reduction in wall thickness of the umbilical cord arteries and vein has been found in intrauterine growth retardation (IUGR) infants with abnormal umbilical artery flow as compared to IUGR infants without increased umbilical artery resistance.[12] So it can be concluded that reduction in umbilical cord thickness and diameter can compromise fetal growth. The present study is in agreement with previous researches that have shown association between umbilical cord thickness or cross-sectional area with IUGR, LBW, or meconium staining.[3–5] However, in contrast with some of those studies, in our study we examined a free floating loop of umbilical cord (and not necessarily the site of insertion of the cord at the abdomen).
We did not find any correlation between the USG measurements and the 5-min Apgar score.
Pediatricians consider the Apgar score as a practical method for urgent systematic evaluation of a newborn to detect the need for resuscitation. A low Apgar score is the result of a relatively acute and short-term insult. LBW, on the other hand, maybe due to IUGR, preterm delivery, or both, and is a major factor affecting neonatal and infantile mortality. It has been directly correlated to the infant mortality rate in different countries.[13] LBW likely reflects a severe and long-term pathological process, which is more likely to be associated with decrease in the Wharton's jelly content of the umbilical cord. This is probably why the umblical cord indices predict LBW better than the Apgar score.
No statistically significant difference was noted between umbilical cord thickness and cross-sectional area in predicting LBW and meconium staining.
Degani et al, showed statistical correlation of hypocoiled umbilical cord with SGA in the early second trimester.[14] Predanic et al, showed an association between UCI and SGA, but did not find any correlation between UCI and a low 5-min Apgar score in the second trimester.[11] Our study did not show any correlation between UCI and LBW or low 5-min Apgar score. The reason for this difference between our findings and that of other authors might be as follows: we measured only one segment of the umbilical cord, whereas Degani et al, measured several segments. Also, the two above studies examined the cord in the second trimester, while we did so in the second half of gestation. It can be postulated that coiling is not uniform throughout the cord length, and as a consequence occasionally, USG-measured UCI is not a good indicator of the true coiling of the umbilical cord (in contrast to the data from some previous studies).[15,16] As a result UCI does not show any correlation with birth weight or other clinical measures in the newborn. One other hypothesis may be that there is progressive inhomogeneity in the coiling pattern of the umbilical cord with increase in gestational age, so that studies performed earlier in the course of gestation (for example, in the second trimester) allow more accurate measurement of umbilical coiling. Overall, to measure the UCI, evaluating several segments of the umbilical cord seems necessary.
In conclusion, our study confirms that umbilical cord thickness and cross-sectional area are easy to measure in a free loop of umbilical cord and both are correlated with LBW and meconium staining in the second half of gestation. Thus, routine antenatal assessment of umbilical cord thickness and area can be helpful in identifying fetuses at risk. If coiling is measured, we strongly recommend that several segments be examined to ensure a more accurate estimation.
Footnotes
Source of Support: Nil
Conflict of Interest: None declared.
References
- 1.Qureshi F, Jacques SM. Marked segmental thinning of the umbilical cord vessels. Arch Pathol Lab Med. 1994;118:828–30. [PubMed] [Google Scholar]
- 2.Sun Y, Arbucku S, Hocking G, Billso V. Umbilical cord stricture and intrauterine fetal death. Pediatr Pathol Lab Med. 1995;5:723–32. doi: 10.3109/15513819509027008. [DOI] [PubMed] [Google Scholar]
- 3.Raio L, Ghezzi F, Di Naro E, Franchi M, Magmon E, Muller MD, et al. Prenatal diagnosis of a “lean” umbilical cord;a simple marker for fetus at risk of being small for gestational age at birth. Ultrasound Obstet Gynecol. 1999;3:176–80. doi: 10.1046/j.1469-0705.1999.13030176.x. [DOI] [PubMed] [Google Scholar]
- 4.Goynumer G, Ozdemir A, Wetherilt L, Durukan B, Yayla M. Umbilical cord thickness in the first and early second trimesters and perinatal outcome. J Perinat Med. 2008;36:523–6. doi: 10.1515/JPM.2008.087. [DOI] [PubMed] [Google Scholar]
- 5.Ghezzi F, Raio L, Günter Duwe D, Cromi A, Karousou E, Dürig P. Sonographic umbilical vessel morphometryand perintaloutcome offetuses with a lean umbilical cord. J Clin Ultrasound. 2005;33:18–23. doi: 10.1002/jcu.20076. [DOI] [PubMed] [Google Scholar]
- 6.Weissman A, Jakobi P, Bronshtein M, Goldstein I. Sonographic measurements of umbilical cord and vessels during normal pregnancy. J Ultrasound Med. 1994;13:11–4. doi: 10.7863/jum.1994.13.1.11. [DOI] [PubMed] [Google Scholar]
- 7.Predanic M, Perni SC, Chasen ST. The umbilical cord thickness measured at 18-23 weeks of gestational age. J Matern Fetal Neonatal Med. 2005;17:111–6. doi: 10.1080/14767050500042824. [DOI] [PubMed] [Google Scholar]
- 8.Togni FA, AraujoJúnior E, Vasques FA, Moron AF, Torloni MR, Nardozza LM. The cross sectional area of umbilical cord components in normal pregnancy. Int J Gynaecol Obstet. 2007;96:156–61. doi: 10.1016/j.ijgo.2006.10.003. [DOI] [PubMed] [Google Scholar]
- 9.Phaloprakarn C, Phupong V, Tannirandorn Y, Uerpairojkit B, Charoenvidhya D, Wacharaprechanont T. First trimester umbilical cord and vessel diameters of Thai fetuses. J Med Assoc Thai. 2004;87:481–5. [PubMed] [Google Scholar]
- 10.Scott JM, Wilkinson R. Further studies on the umbilical cord and its water content. J Clin Pathol. 1978;31:944–80. doi: 10.1136/jcp.31.10.944. [DOI] [PMC free article] [PubMed] [Google Scholar]
- 11.Predanic M, Perni SC, Chasen ST, Baergen RN, Chervenak FA. Ultrasound evaluation of abnormal umbilical cord coiling in second trimester of gestation in association with adverse pregnancy outcome. Am J Obstet Gynecol. 2005;193:387–94. doi: 10.1016/j.ajog.2004.12.092. [DOI] [PubMed] [Google Scholar]
- 12.Scott JM, Wilkinson R. Further studies on the umbilical cord and its water content. J Clin Pathol. 1978;31:944–8. doi: 10.1136/jcp.31.10.944. [DOI] [PMC free article] [PubMed] [Google Scholar]
- 13.Kliegman RM, Behrman RE, Jenson HB, Stanton BF. 18th ed. Philadelphia: W.B. Saunders Co; 2007. Nelson text book of Pediatrics; pp. 701–2. [Google Scholar]
- 14.Degani S, Leibovich Z, Shapiro I, Gonen R, Ohel G. Early second-trimester low umbilical coiling index predicts small-for-gestational-age fetuses. J Ultrasound Med. 2001;20:1183–8. doi: 10.7863/jum.2001.20.11.1183. [DOI] [PubMed] [Google Scholar]
- 15.Ranna J, Ebert GA, Kappy KA. Adverse prenatal outcome in patients with an abnormal umbilical coiling index. Obstet Gynecol. 1995;85:573–7. doi: 10.1016/0029-7844(94)00435-G. [DOI] [PubMed] [Google Scholar]
- 16.Ezimokhai M, Rizk DE, Thomas L. Maternal risk factors for abnormal vascular coiling of the umbilical cord. Am J Perinatol. 2000;17:441–5. doi: 10.1055/s-2000-13452. [DOI] [PubMed] [Google Scholar]


