
Figure 3.
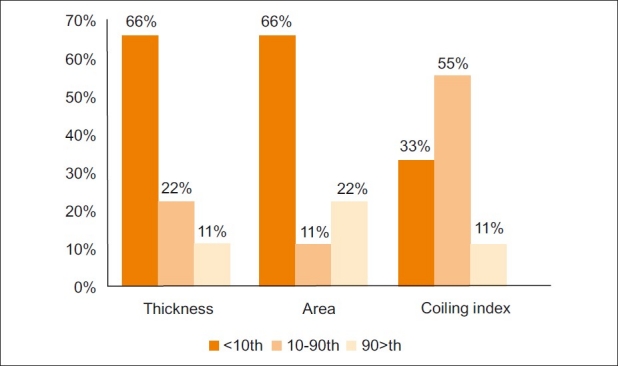
Chart shows the incidence of meconium-stained amniotic fluid in groups with normal and abnormal umbilical cord thickness, cross-sectional area, and coiling index
Official websites use .gov
A
.gov website belongs to an official
government organization in the United States.
Secure .gov websites use HTTPS
A lock (
) or https:// means you've safely
connected to the .gov website. Share sensitive
information only on official, secure websites.
Chart shows the incidence of meconium-stained amniotic fluid in groups with normal and abnormal umbilical cord thickness, cross-sectional area, and coiling index