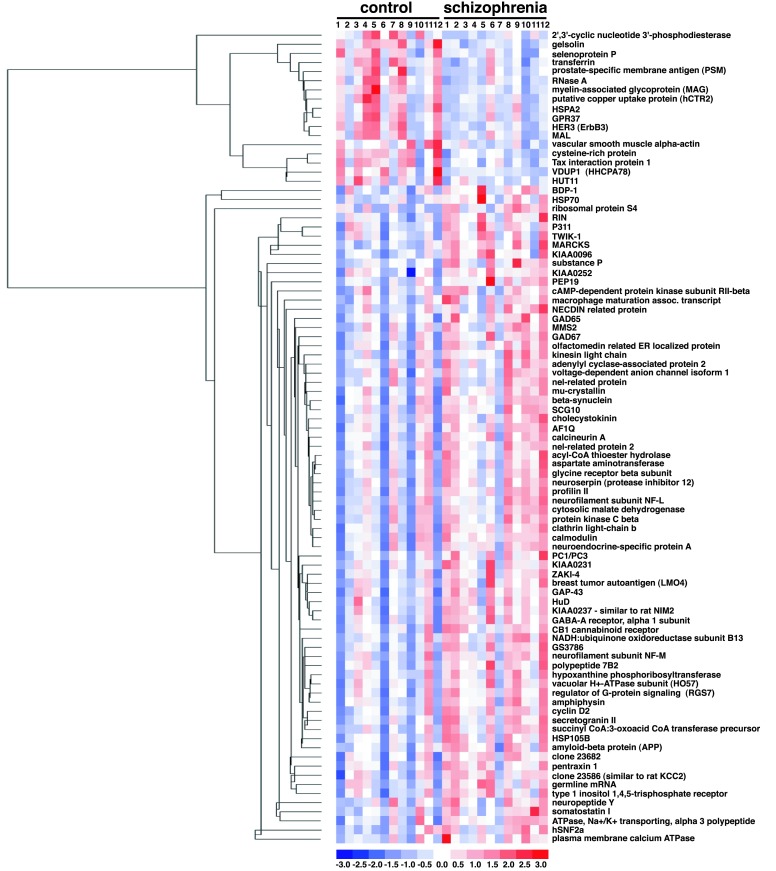
Figure 1.
Relative expression levels of the 89 genes differentially expressed in schizophrenic samples relative to control samples. Each column displays the gene expression levels in individual samples and each row corresponds to the individual genes. The expression values for each gene are normalized to have a mean of 0 and a standard deviation of 1. Expression levels are color coded relative to the mean: blue for values less than the mean, red for values greater than the mean. The dendrogram on the left illustrates the final clustering tree resulting from hierarchical clustering of gene expression values. The branch lengths of the tree reflect the degree of similarity of gene expression values across the 24 samples.

