
Figure 2.
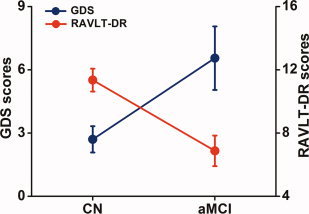
Inverse correlation between depressive symptoms and memory deficits. The results illustrated that RAVLT‐DR scores were significantly lower (F(1,33) = 15.372, P < 0.001), GDS scores were significantly higher (F(1,33) = 7.343, P < 0.01) in the aMCI group compared to the CN group. In addition, GDS scores were inversely correlated with RAVLT‐DR scores (r = −0.37, P < 0.028). Red color for the RAVLT‐DR scores, blue color for the GDS scores, error bar is presented with standard error. [Color figure can be viewed in the online issue, which is available at wileyonlinelibrary.com.]