
Figure 3.
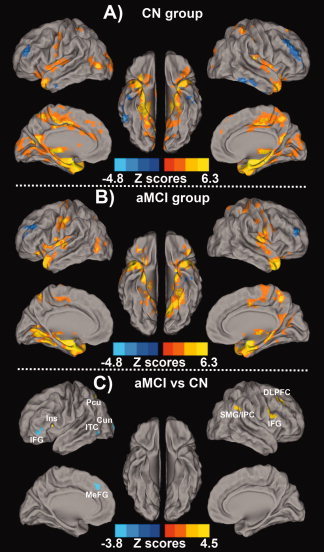
Resting‐state amygdala connectivity network pattern for (A) CN Group, (B) aMCI Group, and (C) differential amygdala connectivity between these two groups. Results are projected on a surface template (Caret software; Van Essen,2005). A: The amygdala connectivity in the CN group was primarily in the bilateral medial temporal lobule, right insula, parietal lobule and middle occipital gyrus; B: The amygdala connectivity in the aMCI group was primarily in the bilateral medial temporal lobule, parietal lobule, occipital lobule, frontal cortex and subcortical regions (both, corrected with AlphaSim, P < 0.01). Bright color indicates positive correlation and blue color indicates negative correlation; C: The altered amygdala connectivity was primarily bilateral frontal‐parietal‐occipital system, as well as left insula and inferior temporal cortex in the aMCI group compared to the CN group. Bright color indicates increased connectivity and blue color indicates decreased connectivity. Color bar is presented with z score. [Color figure can be viewed in the online issue, which is available at wileyonlinelibrary.com.]