
Figure 4.
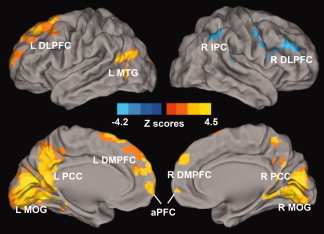
Whole‐brain analyses reveal the effects of memory performance on the amygdala connectivity network. Whole‐brain, partial‐correlation analyses were conducted between the AFC network strength and RAVLT‐DR scores after controlling the GDS scores, RAVLT‐DR, and GDS score interaction, age and group factors as covariances of no interest. Results are projected on a surface template and illustrate that the RAVLT‐DR scores are positively correlated with the strength of the distinct region of the AFC network, except for the right DLPFC and IPC. Bright color indicates positive correlation and blue color indicates negative correlation. Color bar is presented with z score. Abbreviations: L DLPFC, left dorsolateral prefrontal cortex; L MTG, left middle temporal gyrus; L PCC, left posterior cingulate cortex; L DMPFC, left dorsomedial prefrontal cortex; L MOG, left middle occipital gyrus; aPFC, anterior prefrontal cortex; R DMPFC, right dorsomedial prefrontal cortex; R PCC, right posterior cingulate cortex; R MOG, right middle occipital gyrus; R DLPFC, right dorsolateral prefrontal cortex, R IPC, right inferior parietal cortex. [Color figure can be viewed in the online issue, which is available at wileyonlinelibrary.com.]