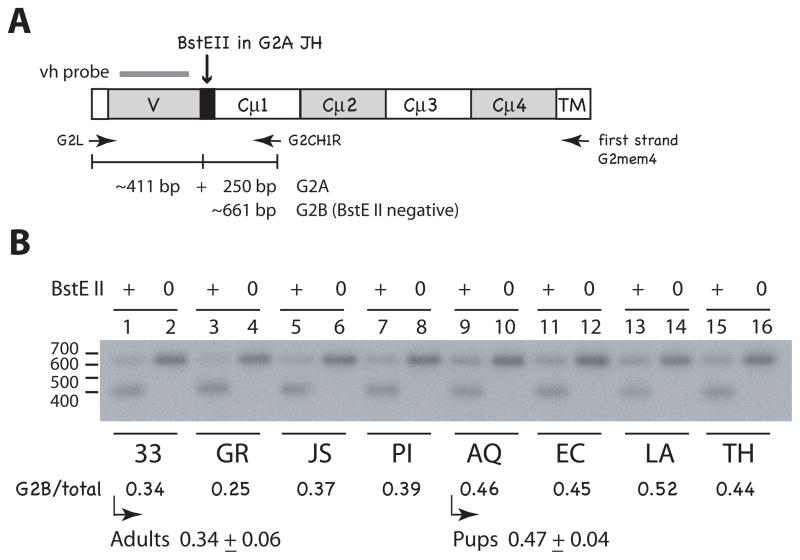
Figure 5.
Comparing G2A and G2B expression in individuals. A. Representation of G2 PCR products and BstE II-digested fragments. The G2 H chain is shown with labeled domains; first strand cDNA primer G2mem4 targets the transmembrane sequence (TM) of both G2A and G2B. PCR primers G2L and G2CH1R generate DNA fragments of ~661 bp (calculated average CDR3 size of 11 codons). G2A sequences can be differentiated from G2B by the BstE II site in G2A JH (black box). Bar over V region represents the vh probe. B. Relative G2A and G2B amounts in pup and adult spleen RNA. RT-PCR products from adult (shark-33 epigonal organ, GR, JS, and PI spleen) and pup RNA (shark-AQ, EC, LA, and TH spleen) were incubated with (+ lanes) or without endonuclease (0 lanes), electrophoresed on a 1.5% TBE gel, and transferred onto a nylon filter (Hybond N+, GE Healthcare). The blot was hybridized to vh probe and submitted for scanning and autoradiography (x-ray film shown). Phosphorimager values obtained: (lane 1) 9759 at 661 bp; 18,497 at 411 bp, (lane 2) 28,405 at 661 bp, (lane 3) 6930; 19,296, (lane 4) 27,624, (lane 5) 9374; 15,764, (lane 6) 24,960, (lane 7) 12,430; 19,732, (lane 8) 31,166, (lane 9) 12,997; 13,720, (lane 10) 27,911, (lane 11) 13,567; 16,951, (lane 12) 30,049, (lane 13) 14,587; 13,441, (lane 14) 27,663, (lane 15) 14,348; 18,677, (lane 16) 32,019. G2B/total is the BstE II-negative band value divided by the value of the untreated sample. For shark-33 (lanes 1 and 2) it would be 9759/18,497 or 0.34 obtained as the proportion of G2B-containing sequences. The mean value with standard deviation is given for adult and pup groups.

