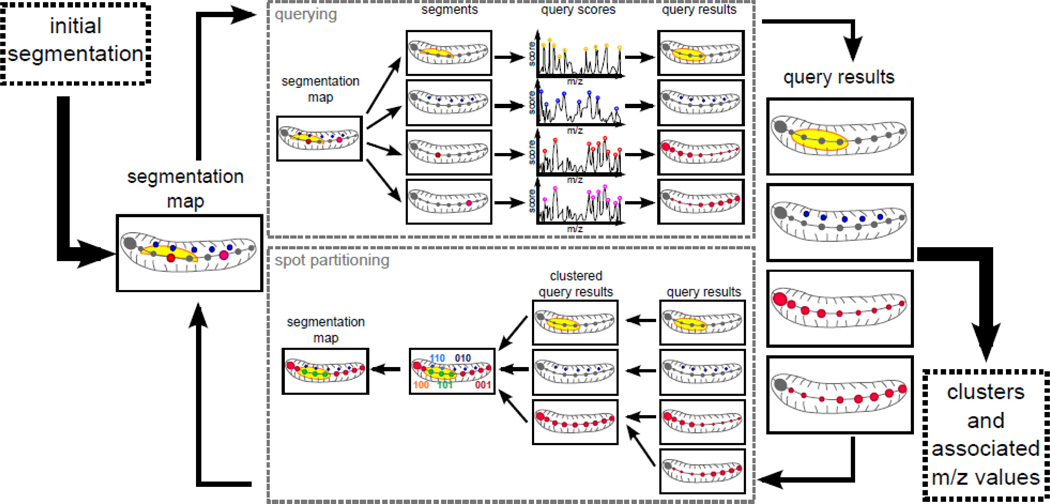
Figure 1.
Main workflow overview. First, we need an initial image- segmentation, which can either be defined randomly or by the user. In the querying component, each of the segment from the image-segmentation is used as a query and top-scoring m/z peaks are retained. A log-odds score is calculated for each spot and each query; this score represents the likelihood of a spot belonging to that query. The resulting set of scores per query forms a set of query-results. These are used as input to the spot partitioning component. In this component, the highly similar query-results are clustered together. We then obtain binary signatures for each of the spots and retain the dominating ones as cluster centroids. Clustering the all spots to the closest centroid results in a new image-segmentation. The whole process can be run iteratively until the quality of the segmentation is satisfactory.

