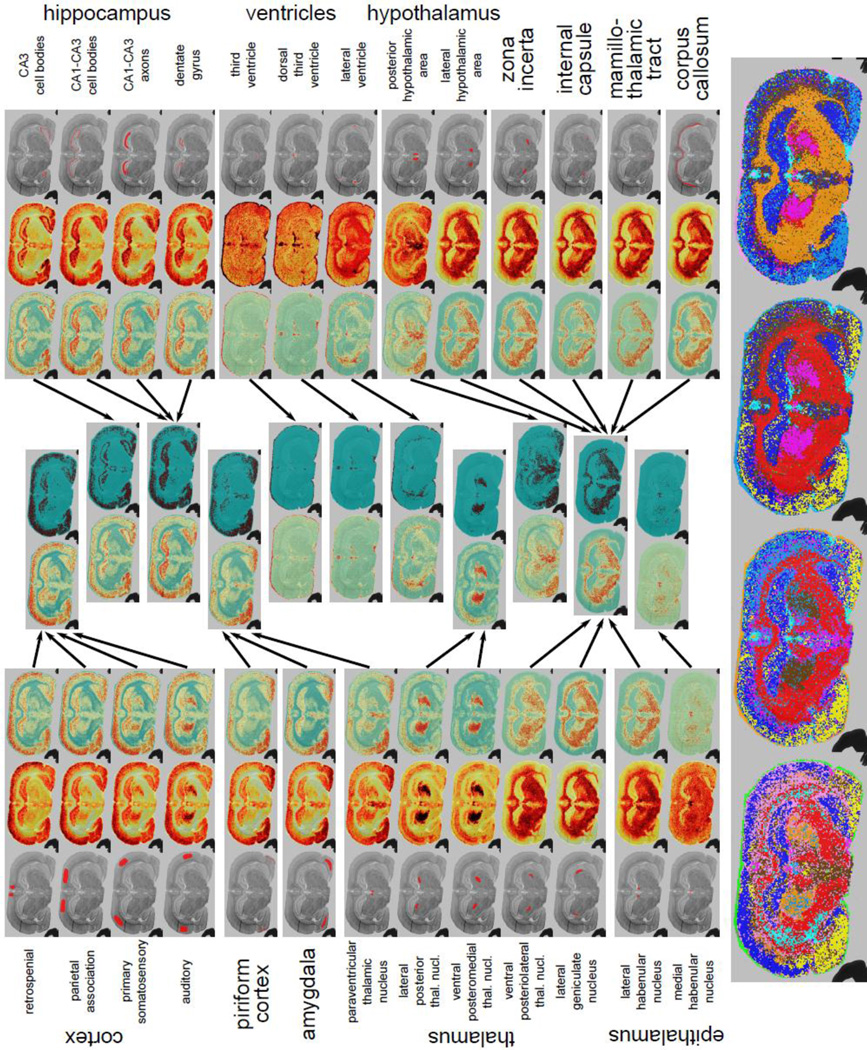
Figure 5.
Results for the rat brain slice dataset. Basic anatomy is provided for reference in Supplemental Figure 13b. The triplet of images associated with each query is composed of the corresponding original query, the weighted intensity image and the log-odds score image (outward towards the middle). The middle panels describe the result of hierarchical clustering after the first iteration. The two images in each cluster represent the resulting average log-odd scores and the binary image after votes. The bottom panels show the image-segmentation results after subsequent iterations. The results show clear demarcations of the morphology.

