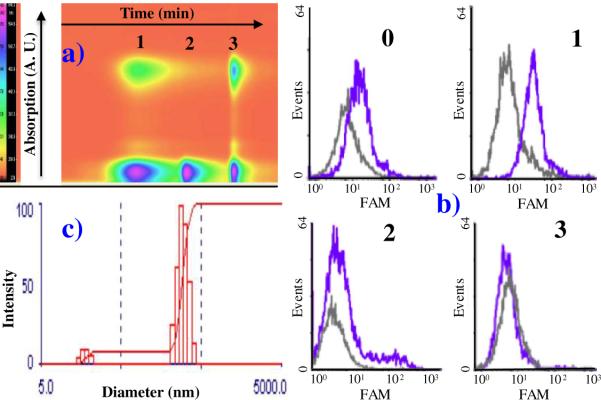
Figure 2. Identification of purified polymeric aptamer where.
a) shows an original HPLC chromatogram with three elution bands, and b) displays the flow cytometry binding test. These flow results prove the functionality of different components in binding to the same target cells. Only fraction 1 in a) gives a positive binding, and the distribution of purified polymeric aptamer is displayed by Dynamic Light Scattering measurements in c).

