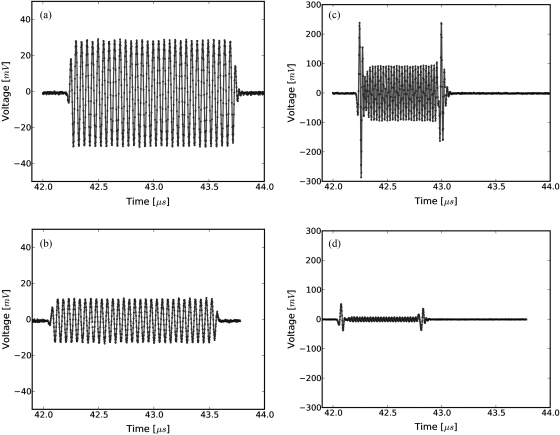
Figure 2.
(Color online) Averaged, received signals obtained using the narrowband substitution method. (a) Water-only signal at 20 MHz, (b) 5 mm sample inserted with the center frequency at 20 MHz, (c) water-only signal at 40 MHz, and (d) sample inserted with the center frequency at 40 MHz. Time is relative to excitation at the source transducer, and the plotted time axes limits are kept consistent to demonstrate time shifts. Amplitudes are kept consistent at each frequency, but the excitation amplitude is adjusted with frequency so sufficient signal-to-noise ratio is obtained without saturation and non-linear propagation. The dramatic effects of frequency-dependent attenuation on the signal shape can be seen in (d).

