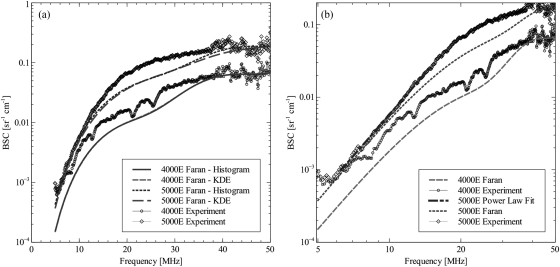
Figure 5.
(Color online) Absolute backscatter coefficient for the two TM phantoms examined. A curve derived from the phantom composition and Faran scattering theory for spherical scatterers is displayed along with results phantom and planar reflector RF data. Dashed lines are the Faran predicted BSC for the acoustic properties assumed for the component materials. Curves with markers represent the experimental results. In (a), Faran curves for both the histogram approximation of size distribution and the KDE approximation of the size distribution are presented. The same data are present in (b) but with logarithmic scaling on both axes. Only the KDE Faran curves are plotted, but results from power law fit of the 5000E experimentally determined data in the 6-15 MHz range are also shown.

