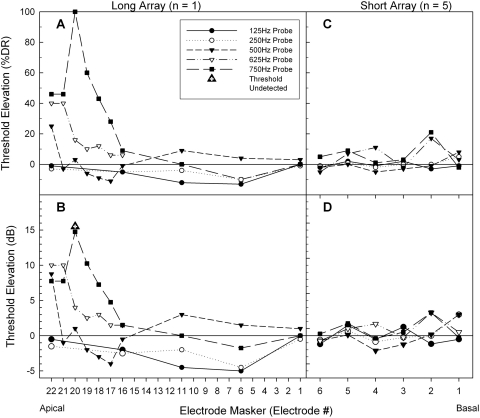
Figure 2.
(A) Electric masking patterns reflected by threshold elevation of the pure tones (% dynamic range) as a function of masking electrode location for subject LE1. (B) Threshold elevation (in dB) for subject LE1. (C) Average threshold elevation for Iowa∕Nucleus hybrid subjects SE1, SE3, SE21, SE26, and SE27. (D) Average threshold elevation (in dB) for the five Iowa∕Nucleus hybrid subjects.

