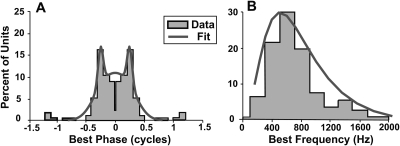
Figure 1.
(A) Best-phase distribution for ITD-sensitive inferior colliculus units. The distribution is based on the data from one side of the brain (Hancock and Delgutte, 2004, shown as gray-filled histogram) by assuming left∕right symmetry. Reprinted with permission. The model used a best sum-of-Gaussians fit, shown by the solid gray line. (B) Best-frequency distribution taken from the same study (Hancock and Delgutte, 2004, shown as gray-filled histogram). The model used a best lognormal fit, shown by the solid gray line.

