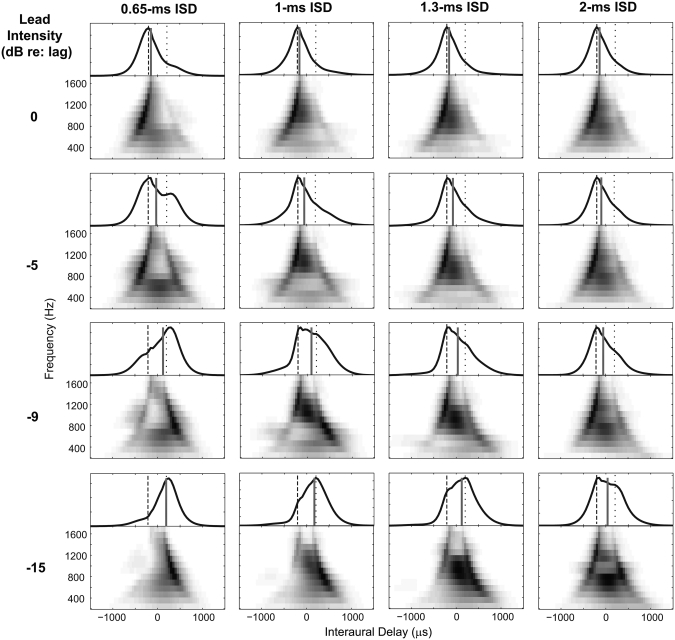
Figure 3.
Long-term IACC functions based on the outputs of left- and right-ear AN model outputs. Within each panel, the abscissa shows the interaural delay of the IACC function; the ordinate shows the CF of model neurons making up the population. The IACC functions were weighted by the across-best-phase distribution and the across-frequency distribution. The weighted IACCs integrated across frequency are shown on the top of each panel as a function of ITD, with gray bars indicating the centroid ITD. The dashed and dotted lines indicate the ITDs used to construct the leading and lagging clicks of the input stimulus, respectively.

