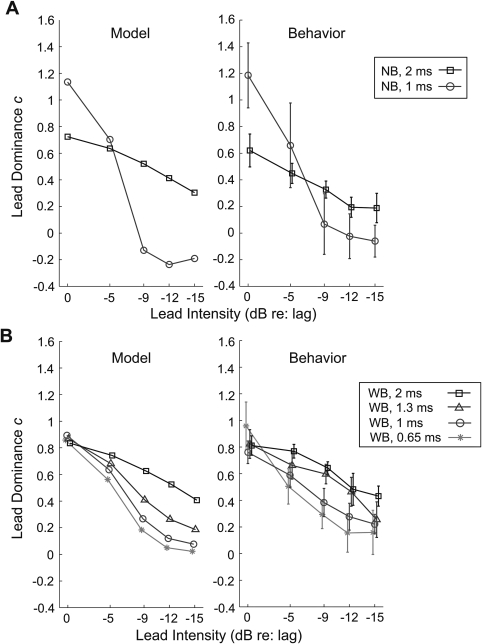
Figure 4.
The lead dominance value, c, as a function of the intensity of the leading click. The left panels show c values predicted by the model. The right panels show the corresponding c values estimated from the behavioral results. Error bars indicate the 90% confidence intervals. (A) c values for narrowband clicks (NB). (B) c values for wideband clicks (WB). The ISDs of the paired clicks are specified in the legend.

