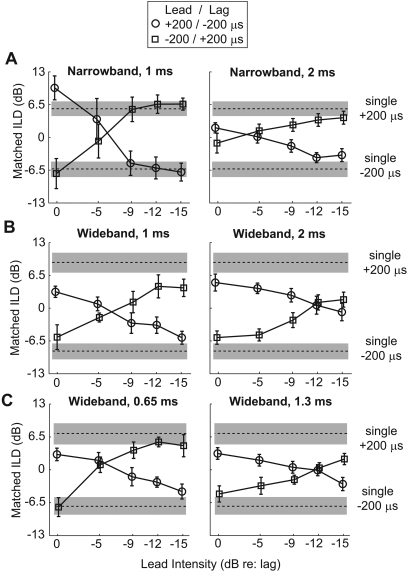
Figure 5.
Lateralization judgments, averaged across subjects, as a function of the level of the leading click. Error bars show the 90% confidence intervals around the means. The lagging click was always symmetrically opposite the lead, which had an ITD of either +200-μs (circles) or −200-μs (squares). The dashed lines show the perceived location of a single binaural click presented at the ± 200-μs ITDs, with the gray region surrounding these values displaying the 90% confidence intervals around these means. (A), (B) Lateralization in the main experiment for narrowband and wideband clicks, respectively. (C) Lateralization for wideband clicks in the follow-up experiment.

