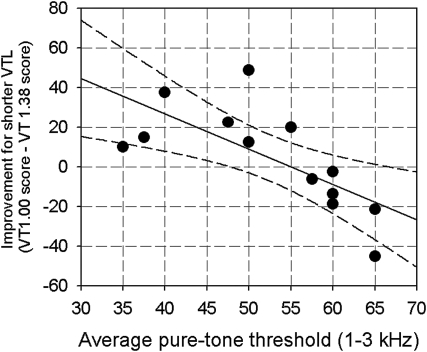
Figure 8.
Improvement in recognition for listeners with hearing loss for a VTL ratio of 1.38 for blocks in which the target was assigned to the shorter VTL, plotted as a function of the average pure-tone threshold between 1 and 3 kHz. The solid line shows a linear regression function fit to the data and the dotted lines define the 95% confidence interval of the regression function.

