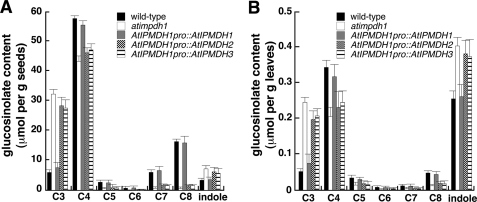
FIGURE 2.
Glucosinolate profile analysis. Glucosinolates in seeds (A) and leaves (B) from wild-type, atipmdh1 mutant, and transgenic plants harboring each AtIPMDH driven by the AtIPMDH1 promoter were analyzed. Levels of aliphatic glucosinolates with varied methylene chain length (C3-C8) are shown. All indole glucosinolates are combined into a single group. Data are mean ± S.D. (n = 3).

