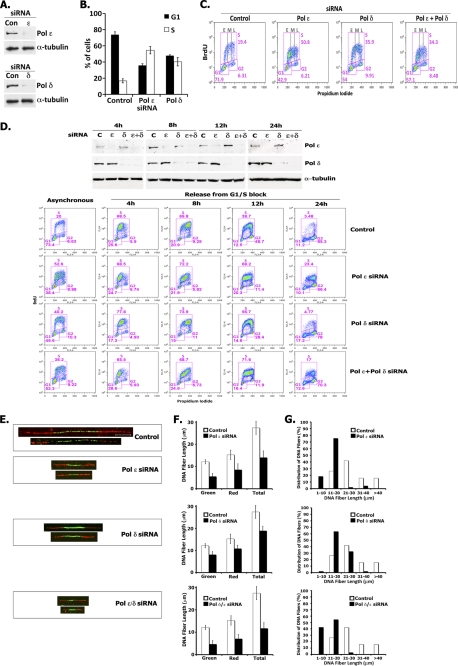
FIGURE 8.
Depletion of hPol ϵ or hPol δ slows down S phase progression. A, siRNA depletion of Pol δ or Pol ϵ. HeLa cells were transfected with control (Con) siRNA or specific siRNAs targeting Pol ϵ or Pol δ (siRNAs used for depletion of Pol ϵ and Pol δ were #08 and #06, respectively; supplemental Fig. 5). The levels of the large subunits of Pol ϵ and Pol δ were measured by immunoblotting 48 h after transfection. To quantitate the extent of depletion of Pol ϵ and Pol δ, the protein levels were adjusted using the α-tubulin loading control and quantified relative to the protein level present in the control sample. B and C, siRNA depletion of Pol δ or Pol ϵ leads to accumulation of cells in S phase. HeLa cells were transfected with control siRNA or with siRNAs targeting either Pol ϵ or Pol δ. After 48 h, cells were incubated with BrdU for 90 min, stained with BrdU-FITC antibody and propidium iodide (PI), and analyzed by flow cytometry. The bar graph (B) shows the percentage of S phase (BrdU-positive) cells versus G1 phase cells present in each sample. Plots (C) show BrdU incorporation (y axis), DNA content (x axis), and cell cycle distribution (described for B) of HeLa cells following siRNA treatment. The distribution of cells present in early (E), middle (M), and late (L) S phase is also indicated. D, Pol ϵ-depleted cells progress more slowly through S phase. HeLa cells were transfected with control siRNA, Pol ϵ siRNA, Pol δ siRNA, or a combination of these siRNAs 4 h before synchronization by double thymidine block. Arrested cells were released into nocodazole-containing medium, harvested at the times indicated following BrdU treatment for 90 min, and analyzed for protein depletion by immunoblotting (top panel) and by flow cytometry (lower panels) as described in A. The BrdU plots show the profiles of samples treated with the indicated Pol ϵ/Pol δ siRNAs compared with control siRNA samples at the indicated cell cycle stage: asynchronous cells, 4 h (early-middle S), 8 h (late S), 12 h (G2), and 24 h (mitosis). E–G, replication fork progression analyses. HeLa cells transfected with Pol ϵ or Pol δ siRNA alone and with both siRNAs were incubated for 20 min with IdU followed by 20 min with CldU and then subjected to replication fork movement analysis. Individual replicating forks were visualized by immunofluorescence of the incorporated halogenated nucleotides present in isolated DNA fibers, as described under “Experimental Procedures.” E, images of fibers. The bar in the fiber image of the control sample corresponds to 10 μm. The mean DNA fiber length was calculated by measuring at least 100 individual fibers in each experiment, and the results were plotted (F). The data from one representative experiment are plotted as percentage of DNA fibers possessing the specified length indicated (G). Error bars, S.E.

