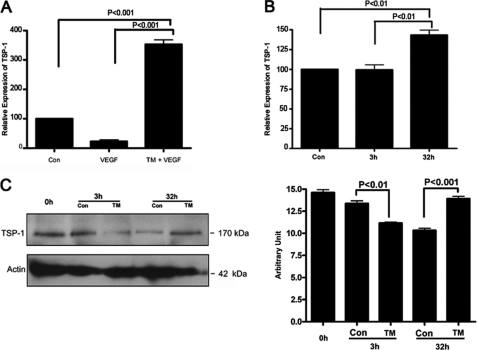
FIGURE 3.
Thrombospondin-1 expression in MatrigelTM implants and in capillary endothelial cells. A, quantification of TSP-1 mRNA expression in MatrigelTM. B, quantification of TSP-1 mRNA expression in capillary endothelial cells after 3 h and 32 h of tunicamycin treatment. C left, TSP-1 protein expression in capillary endothelial cell was examined by immunoblotting (40 μg of total protein) from control and tunicamycin-treated cells (3 h and 32 h). The blot was developed with an anti-TSP-1 antibody (1:1,000; v/v) and anti-actin. C, right, histogram representing quantification of the TSP-1 protein expression as measured by Chem Doc Densitometry (Bio-Rad). The results are an average from three blots done independently.

