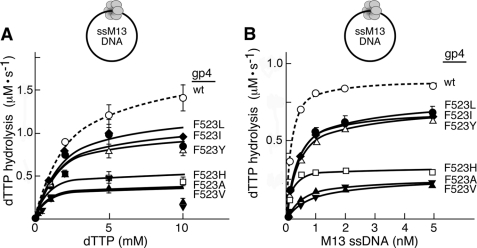
FIGURE 2.
dTTP hydrolysis activity of Phe523 altered gp4. A, the rate of dTTP hydrolysis activity by gp4 variants was measured as a function of dTTP concentration in the presence of circular M13 ssDNA. Reactions contained 100 nm wild-type or altered gp4, 5 nm M13 ssDNA, the indicated concentrations of [α-32P]dTTP, 40 mm Tris-HCl (pH 7.5), 10 mm MgCl2, 10 mm DTT, and 50 mm potassium glutamate. After incubation at 37 °C for 30 min the reaction was stopped by the addition of EDTA to a final concentration of 25 mm. Separation of [α-32P]dTDP from [α-32P]dTTP was carried out on TLC paper coated with polyethyleneimine in a buffer containing 0.5 m lithium chloride and 0.5 m formic acid. The rate of dTTP hydrolysis activity for each of the proteins is plotted against the concentration of [α-32P]dTTP used in the corresponding reactions. The maximal rate of dTTP hydrolysis (Vmax) was calculated using the Michealis-Menten equation with the help of GraphPad Prism software. B, the rate of dTTP hydrolysis activity was monitored as a function of M13 ssDNA concentration. Reactions contained 100 nm wild-type or altered gp4, 5 mm [α-32P]dTTP and M13 ssDNA (concentrations range from 0 to 5 nm), and were carried out as described for A. The KD of gp4 variants for M13 ssDNA was determined from the graph. Please note that in all cases less than 30% of the dTTP is hydrolyzed in 30 min for each of the concentrations examined.

